Zolair Energy Solutions Limited - Financial Visualizations
Revenue Growth
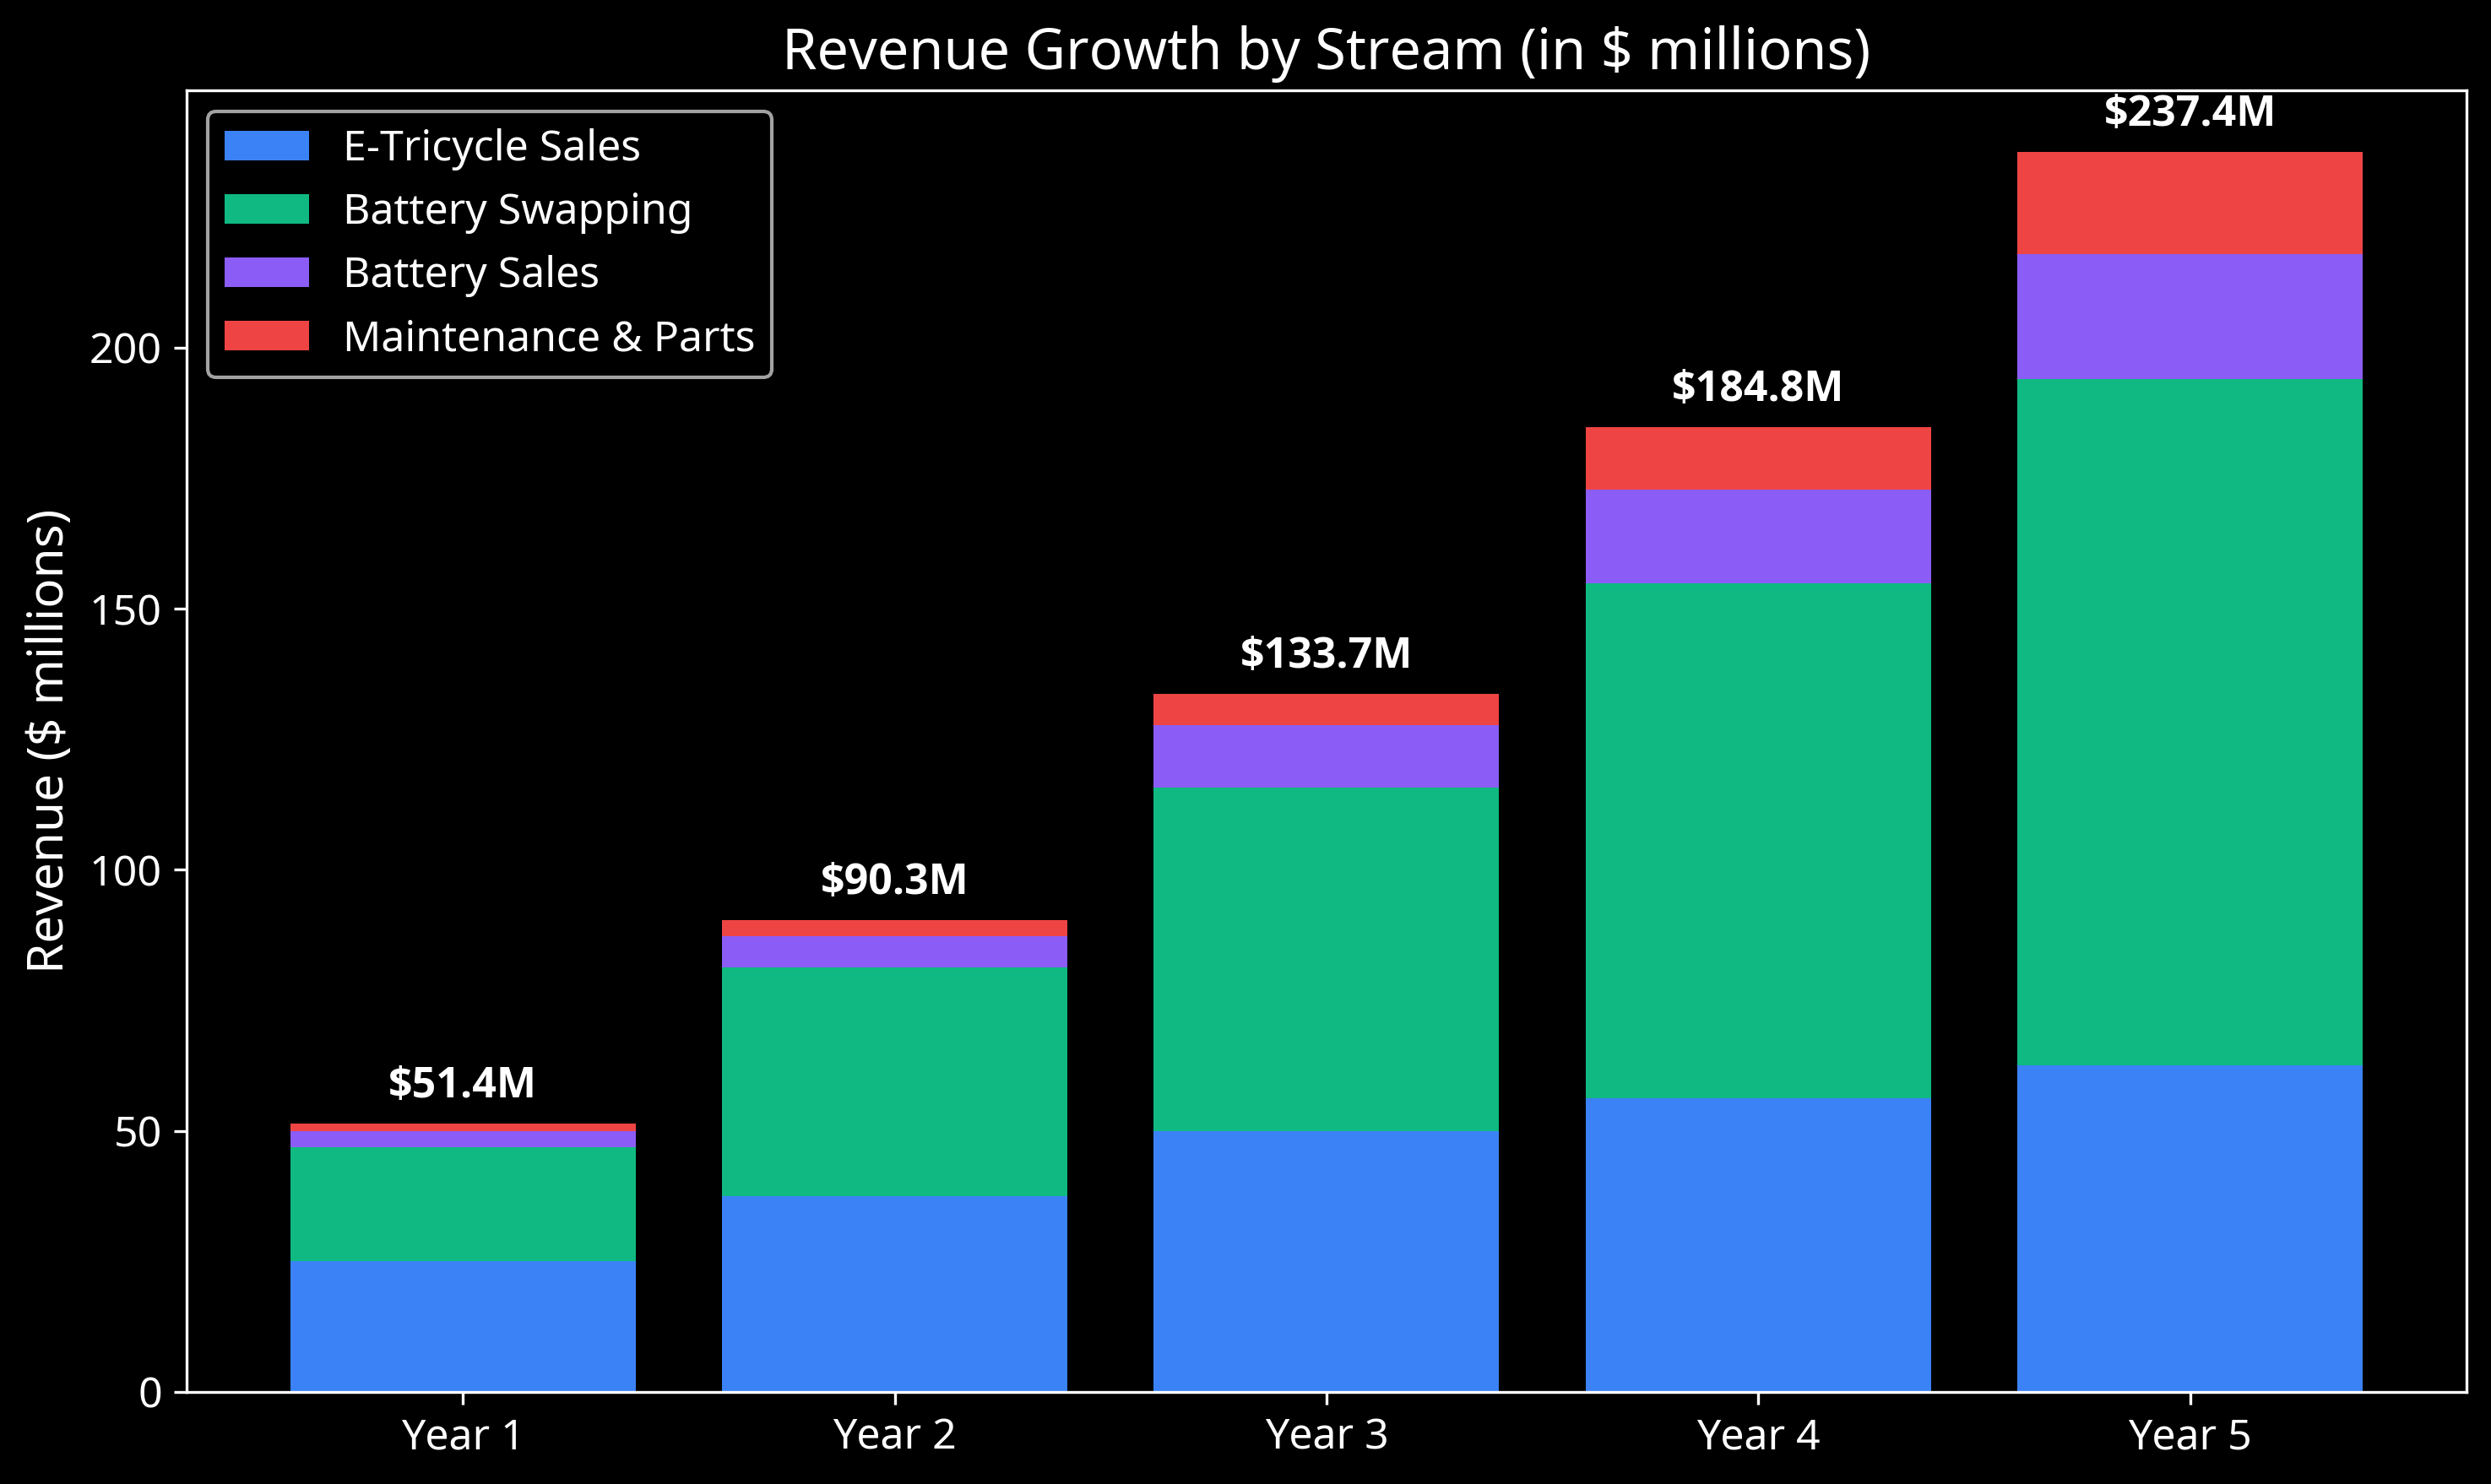
Stacked bar chart showing the growth of all revenue streams over the 5-year projection period, with total revenue reaching $237.4 million by Year 5.
Profitability Metrics
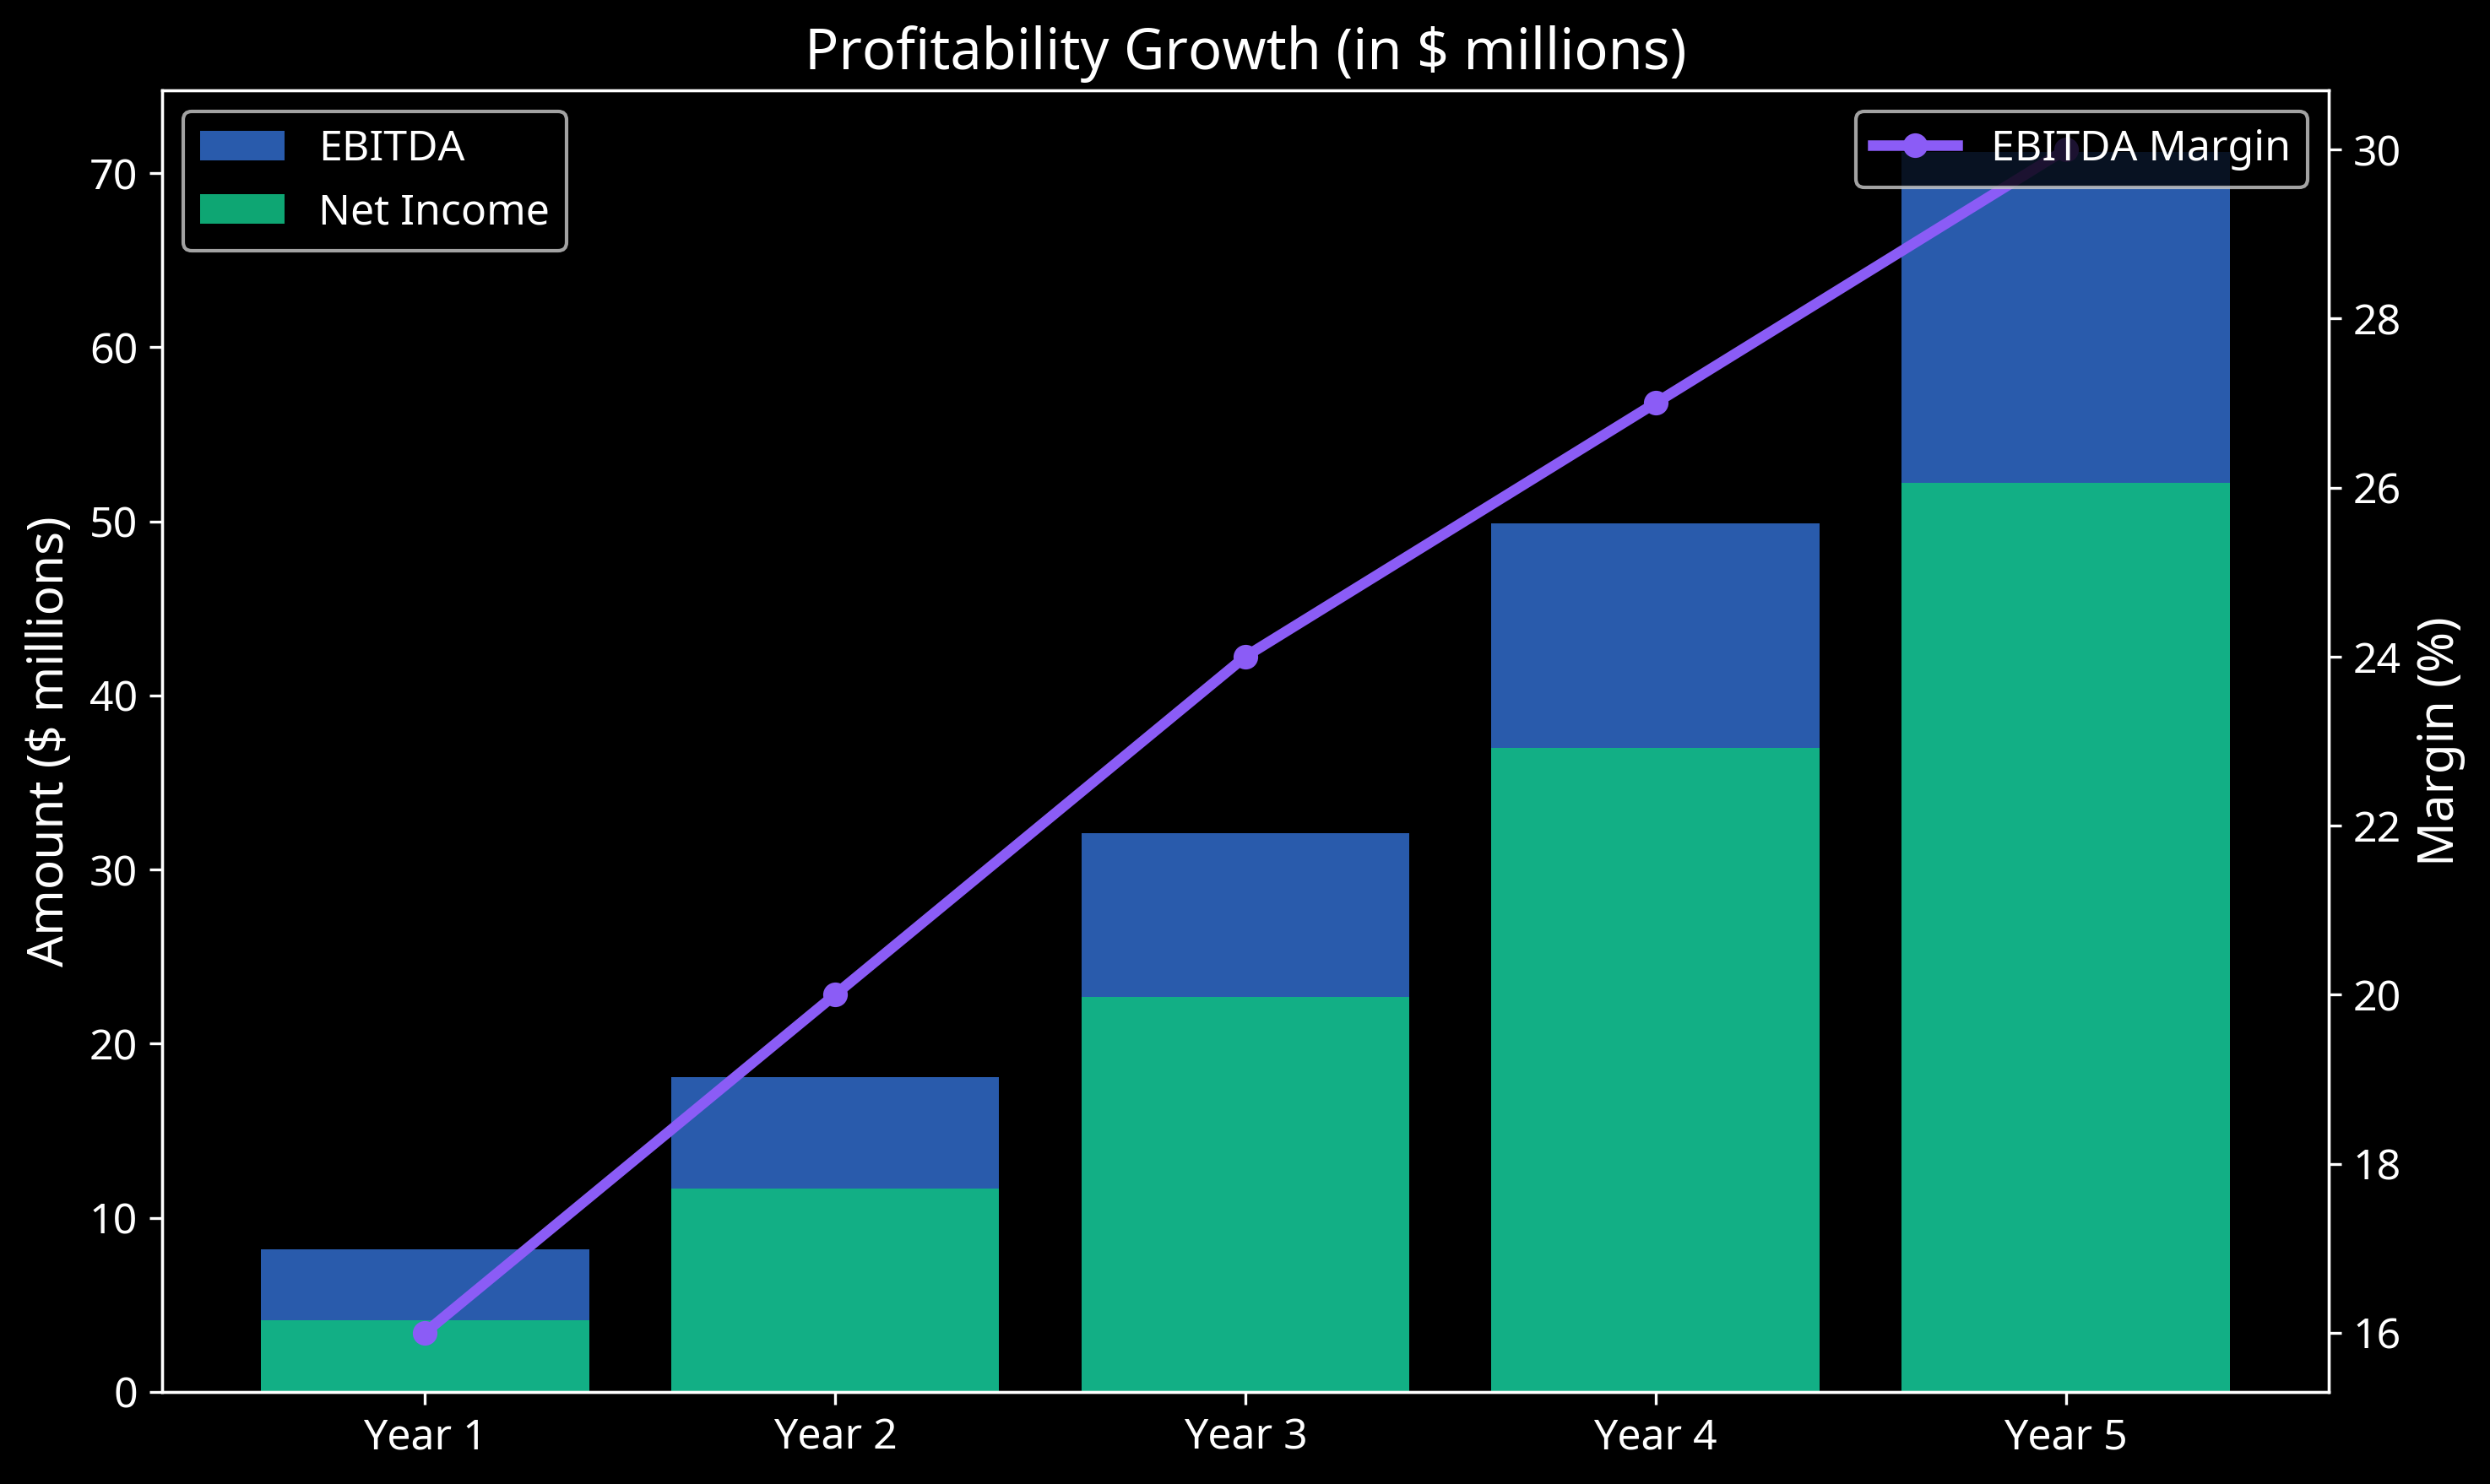
Combined chart showing EBITDA and Net Income growth (bars) alongside EBITDA margin improvement (line), reaching 30% EBITDA margin by Year 5.
Revenue Composition Comparison
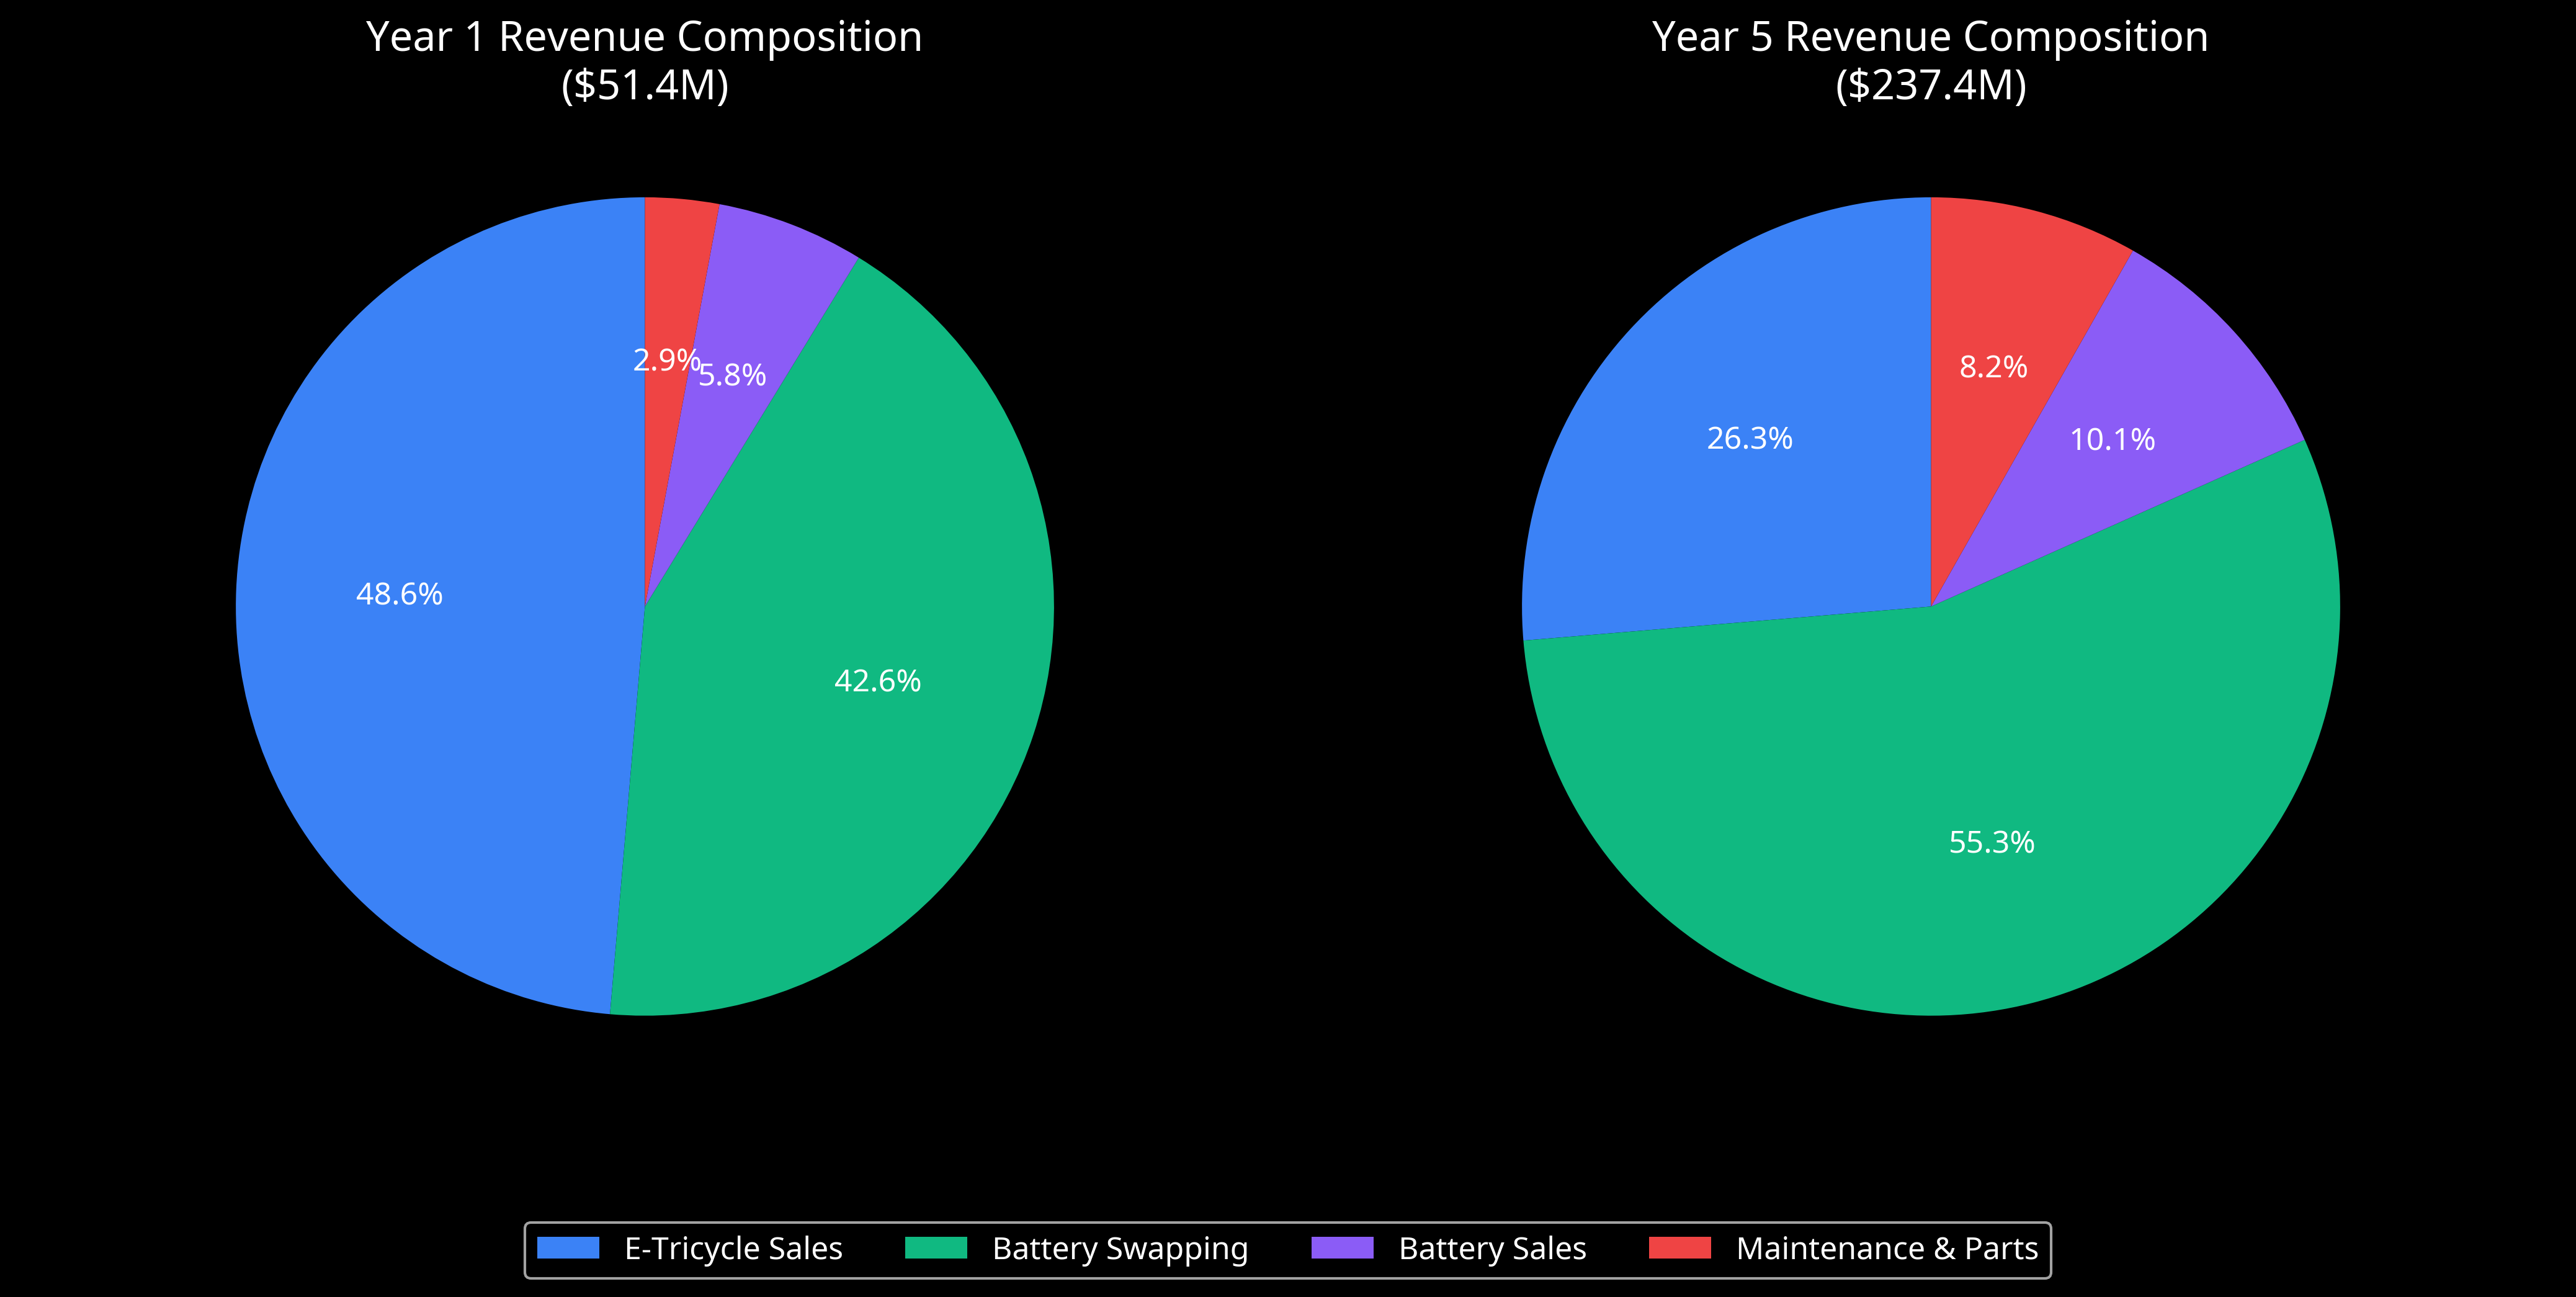
Side-by-side pie charts comparing revenue composition in Year 1 vs Year 5, highlighting the shift toward recurring Battery Swapping revenue (from 42.6% to 55.3% of total revenue).
Return on Investment Analysis
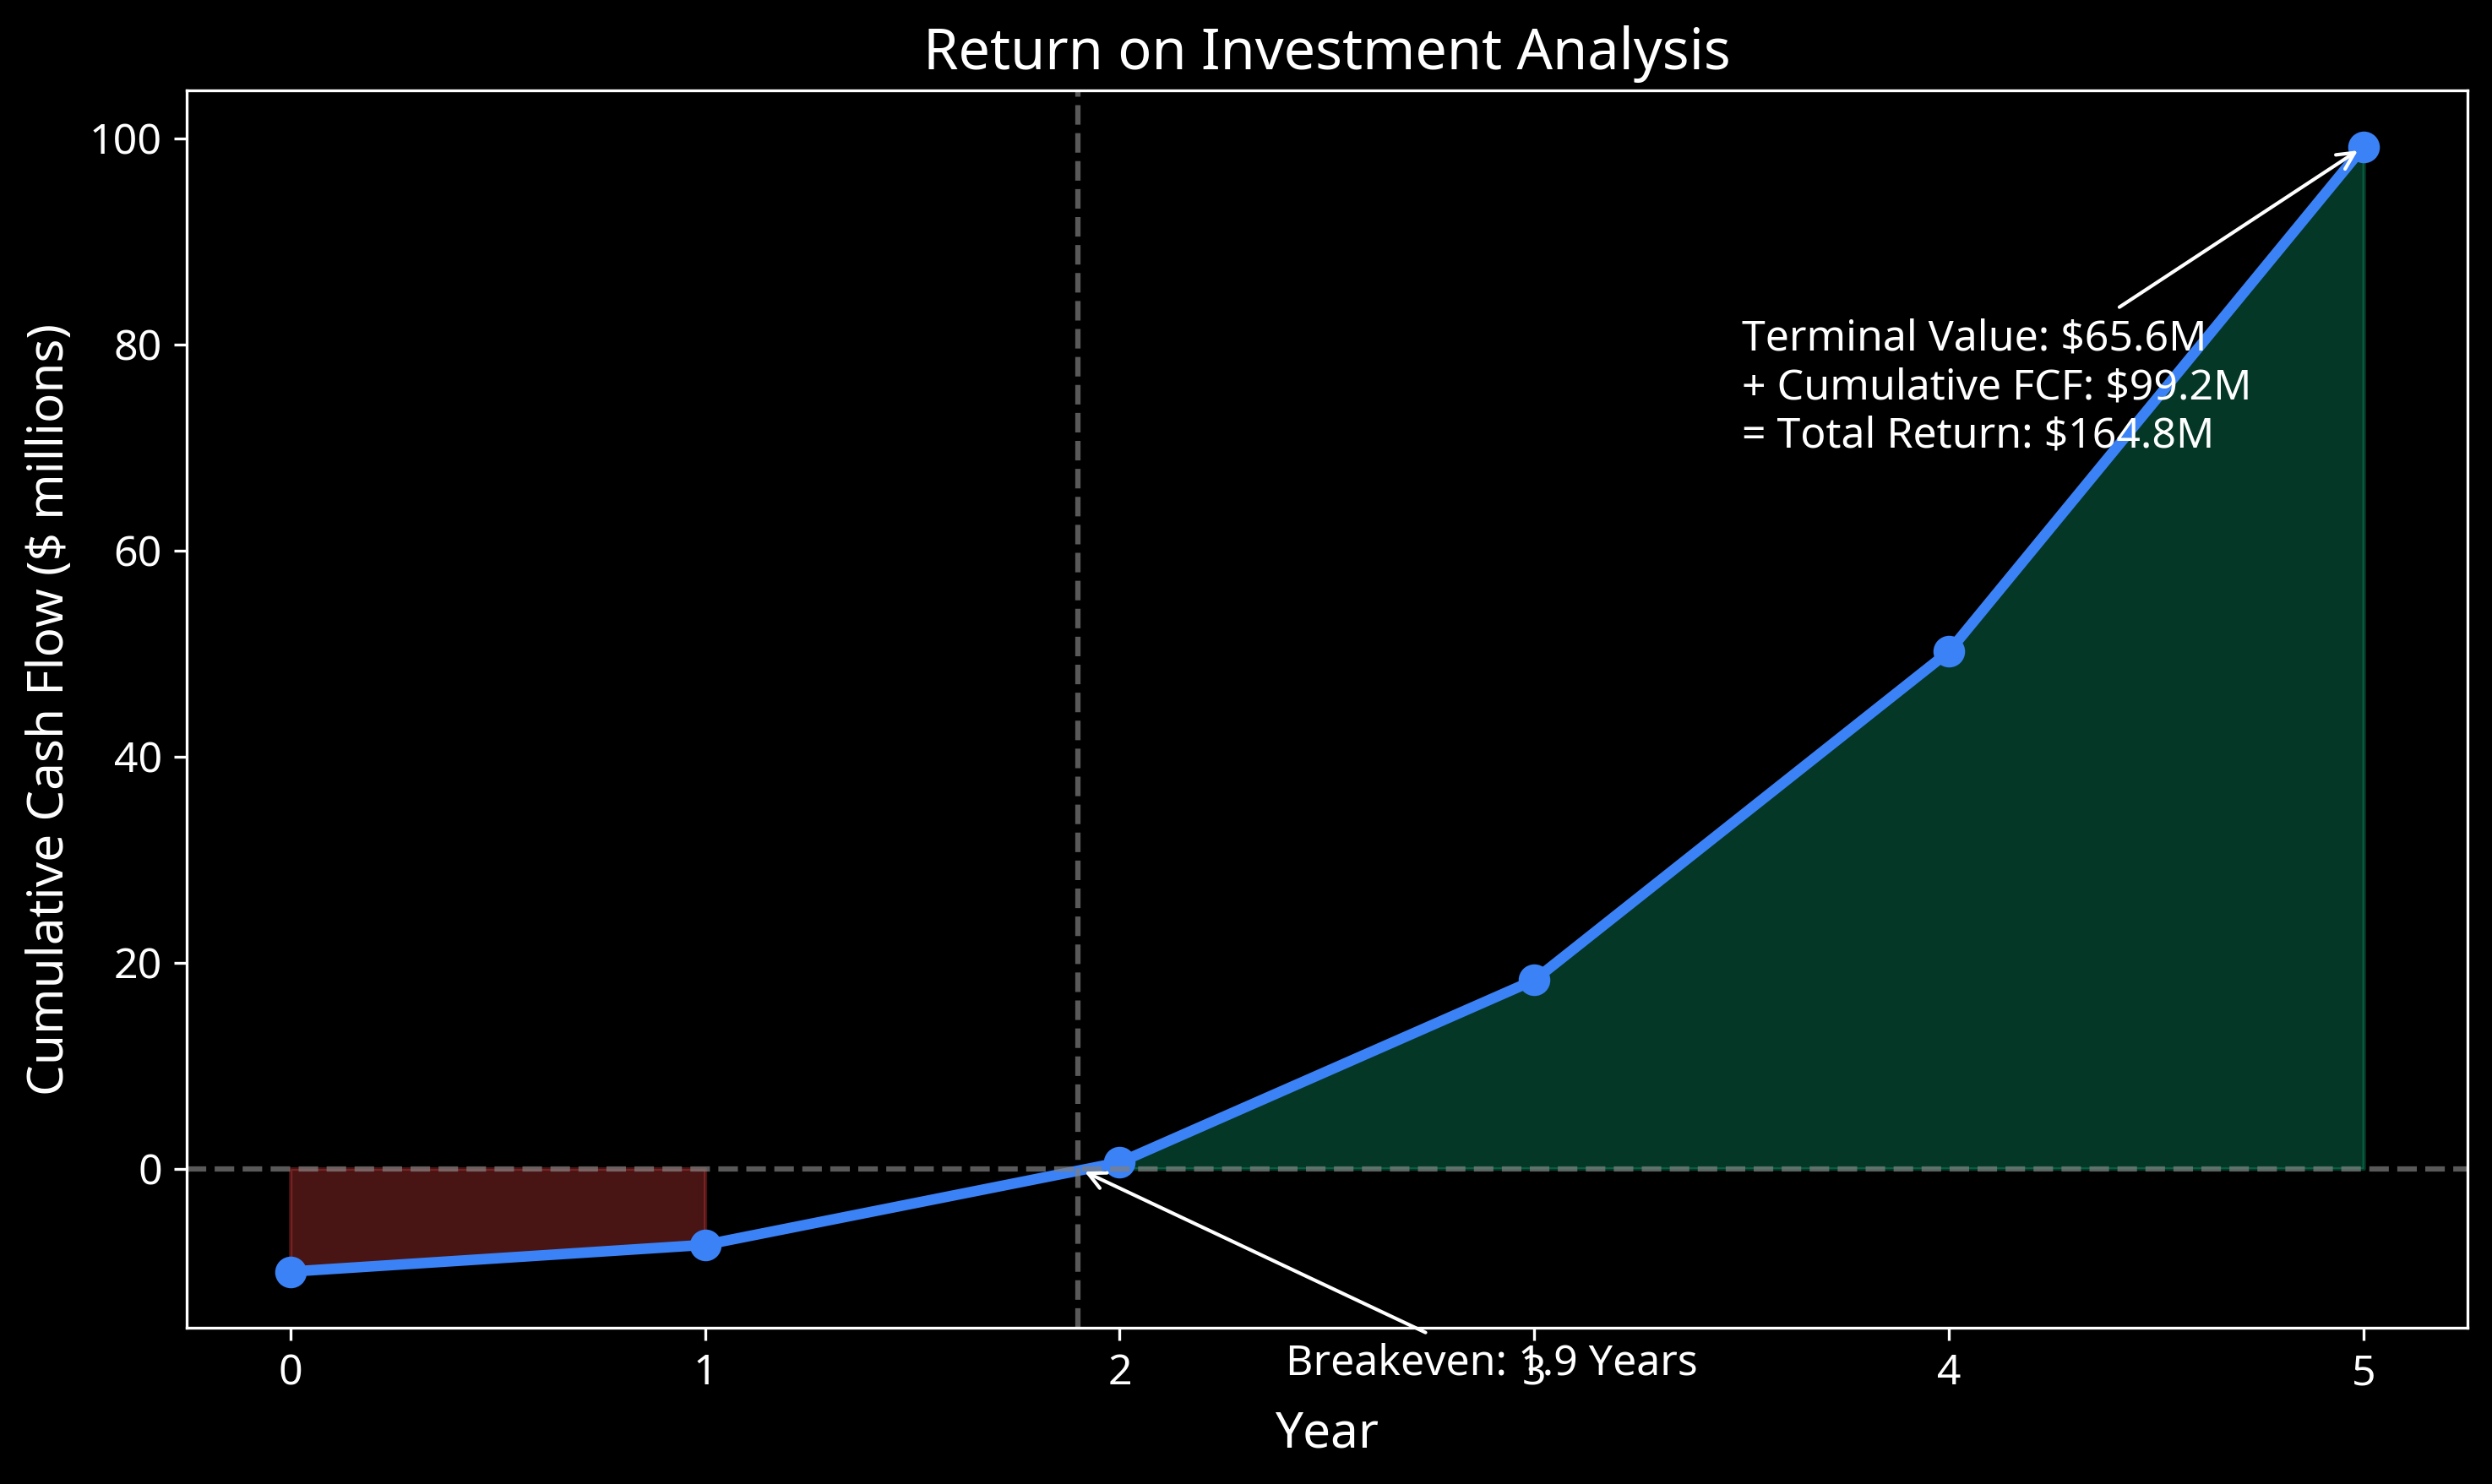
Cumulative cash flow chart showing the 1.9-year breakeven point and the total return of $164.8 million by Year 5 (including terminal value).
Margin Evolution
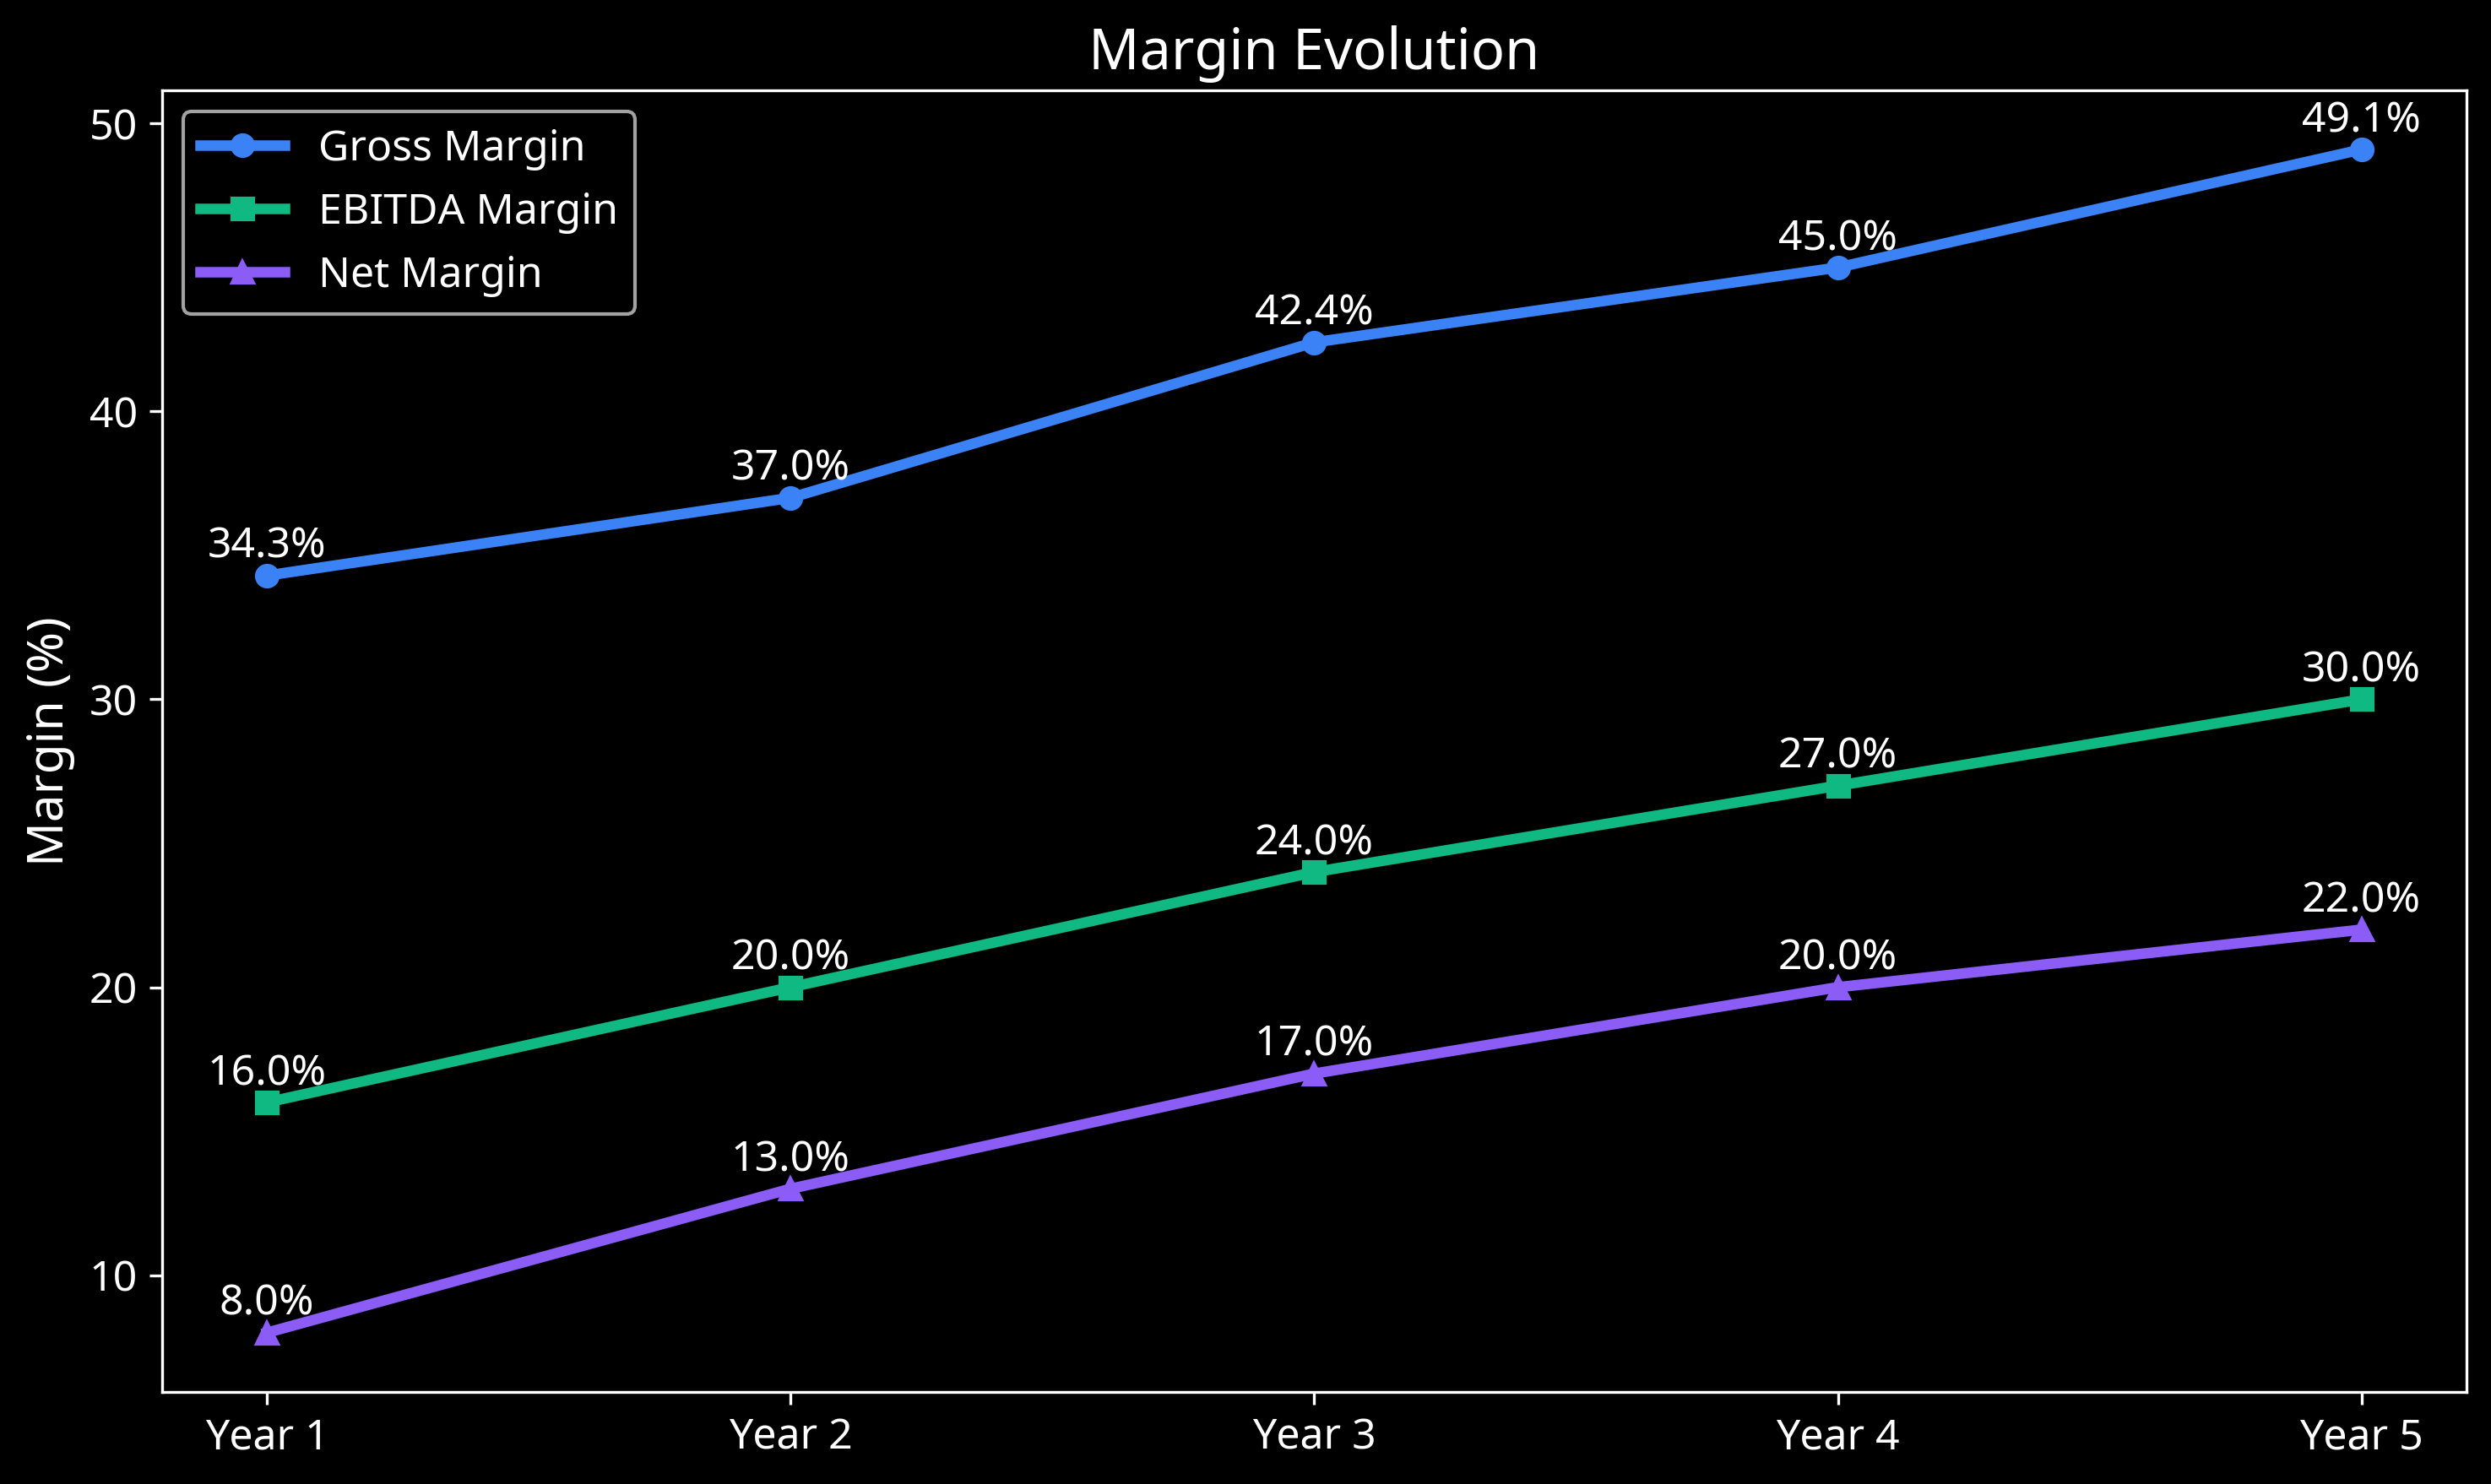
Line chart tracking the improvement of Gross Margin, EBITDA Margin, and Net Margin over the 5-year period, showing consistent profitability improvement.
Investment Return Metrics
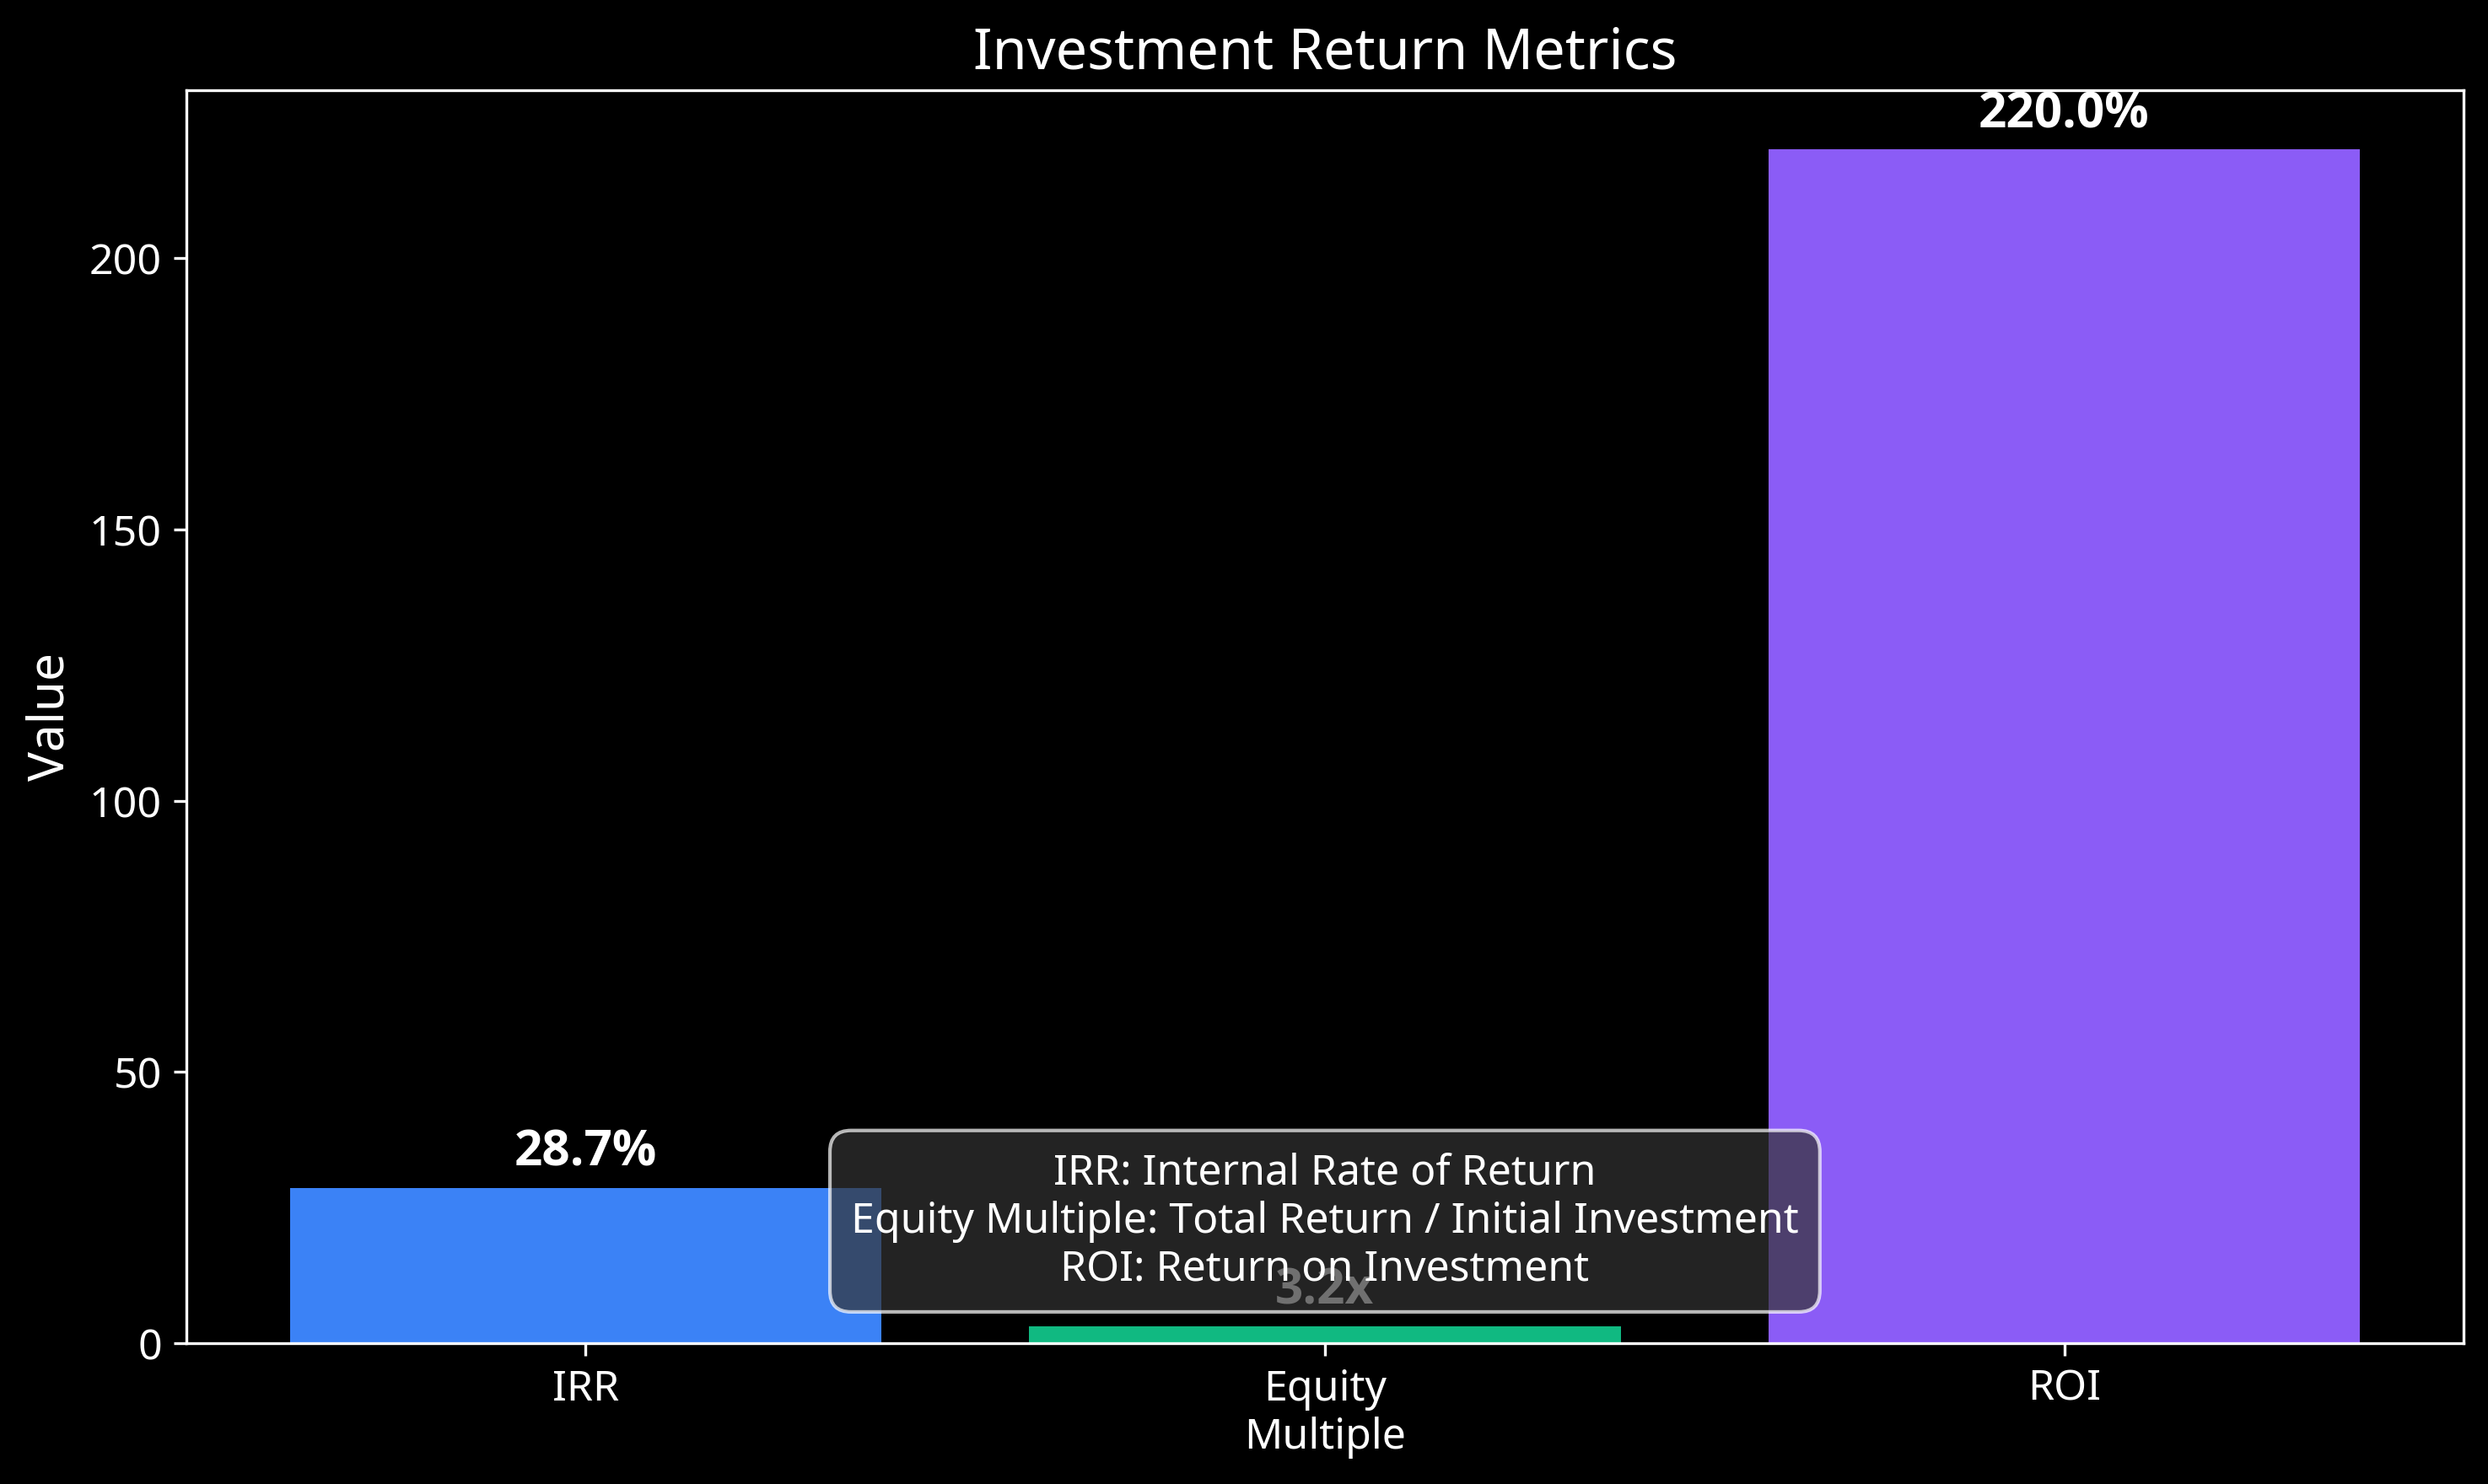
Bar chart highlighting the key investment return metrics: 28.7% IRR, 3.2x Equity Multiple, and 220% ROI.
Pre-Order Distribution
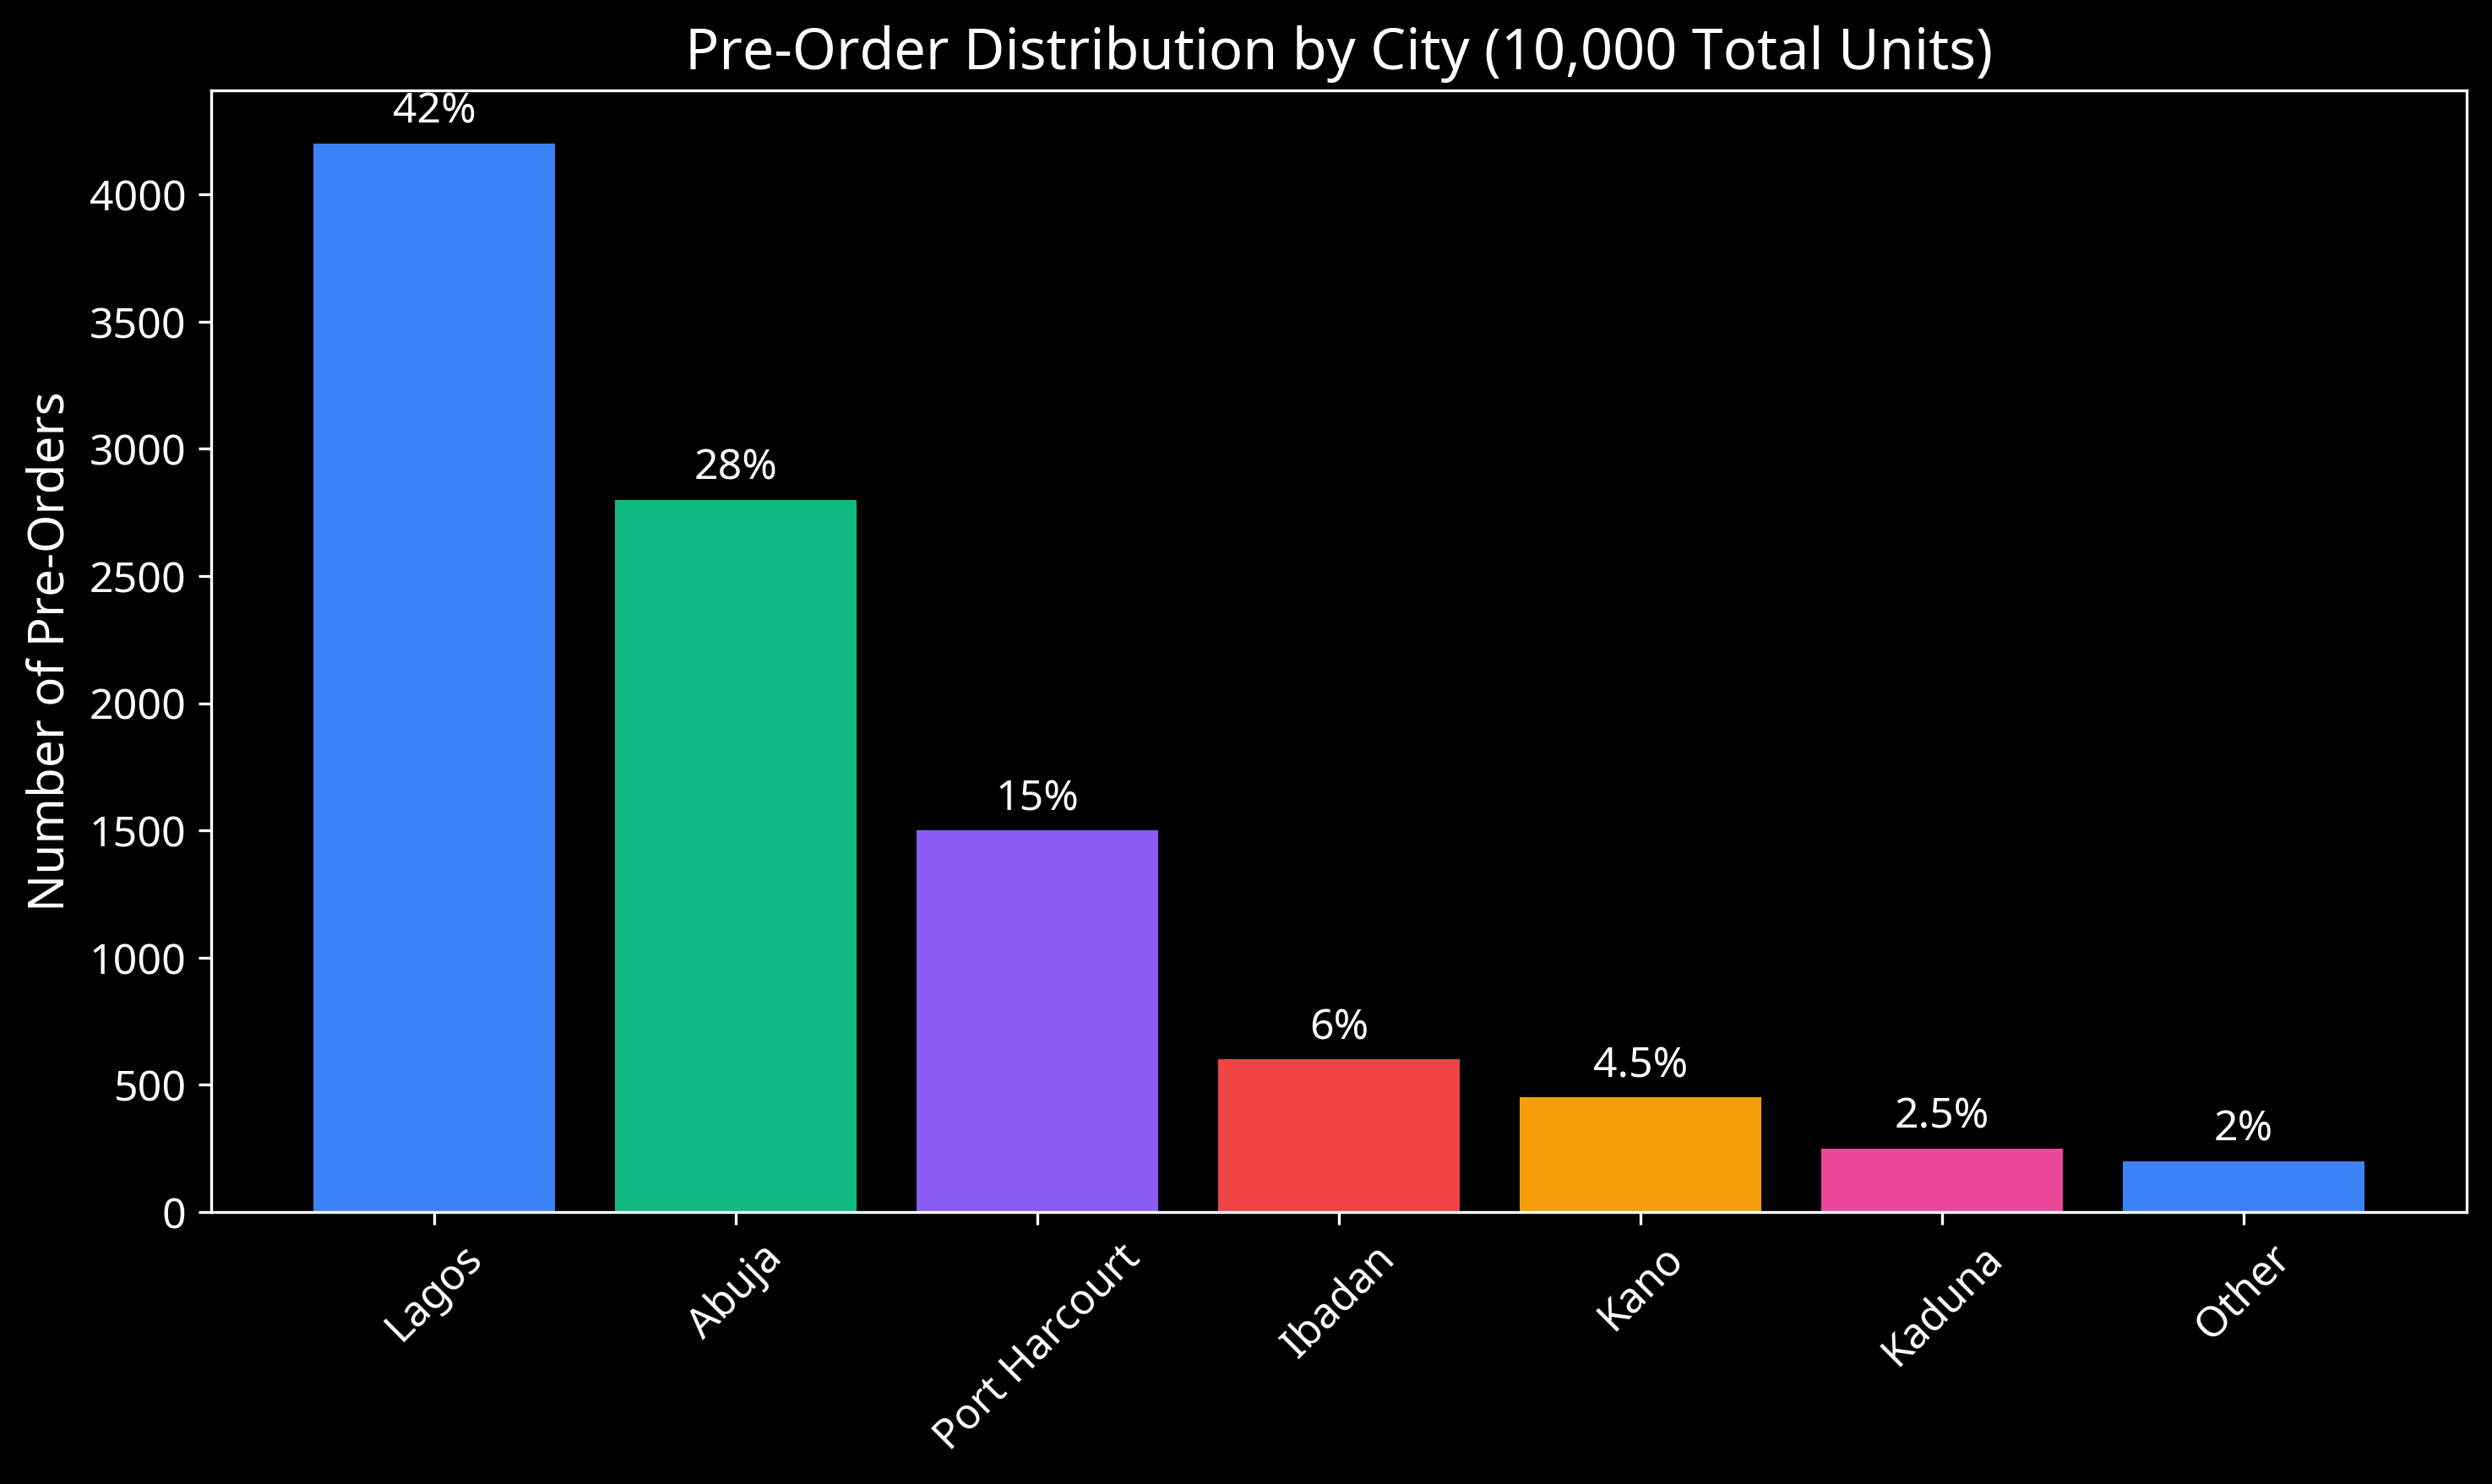
Bar chart showing the distribution of 10,000 pre-orders across major Nigerian cities, with Lagos (42%) and Abuja (28%) representing the largest markets.
Battery Swapping Service Growth
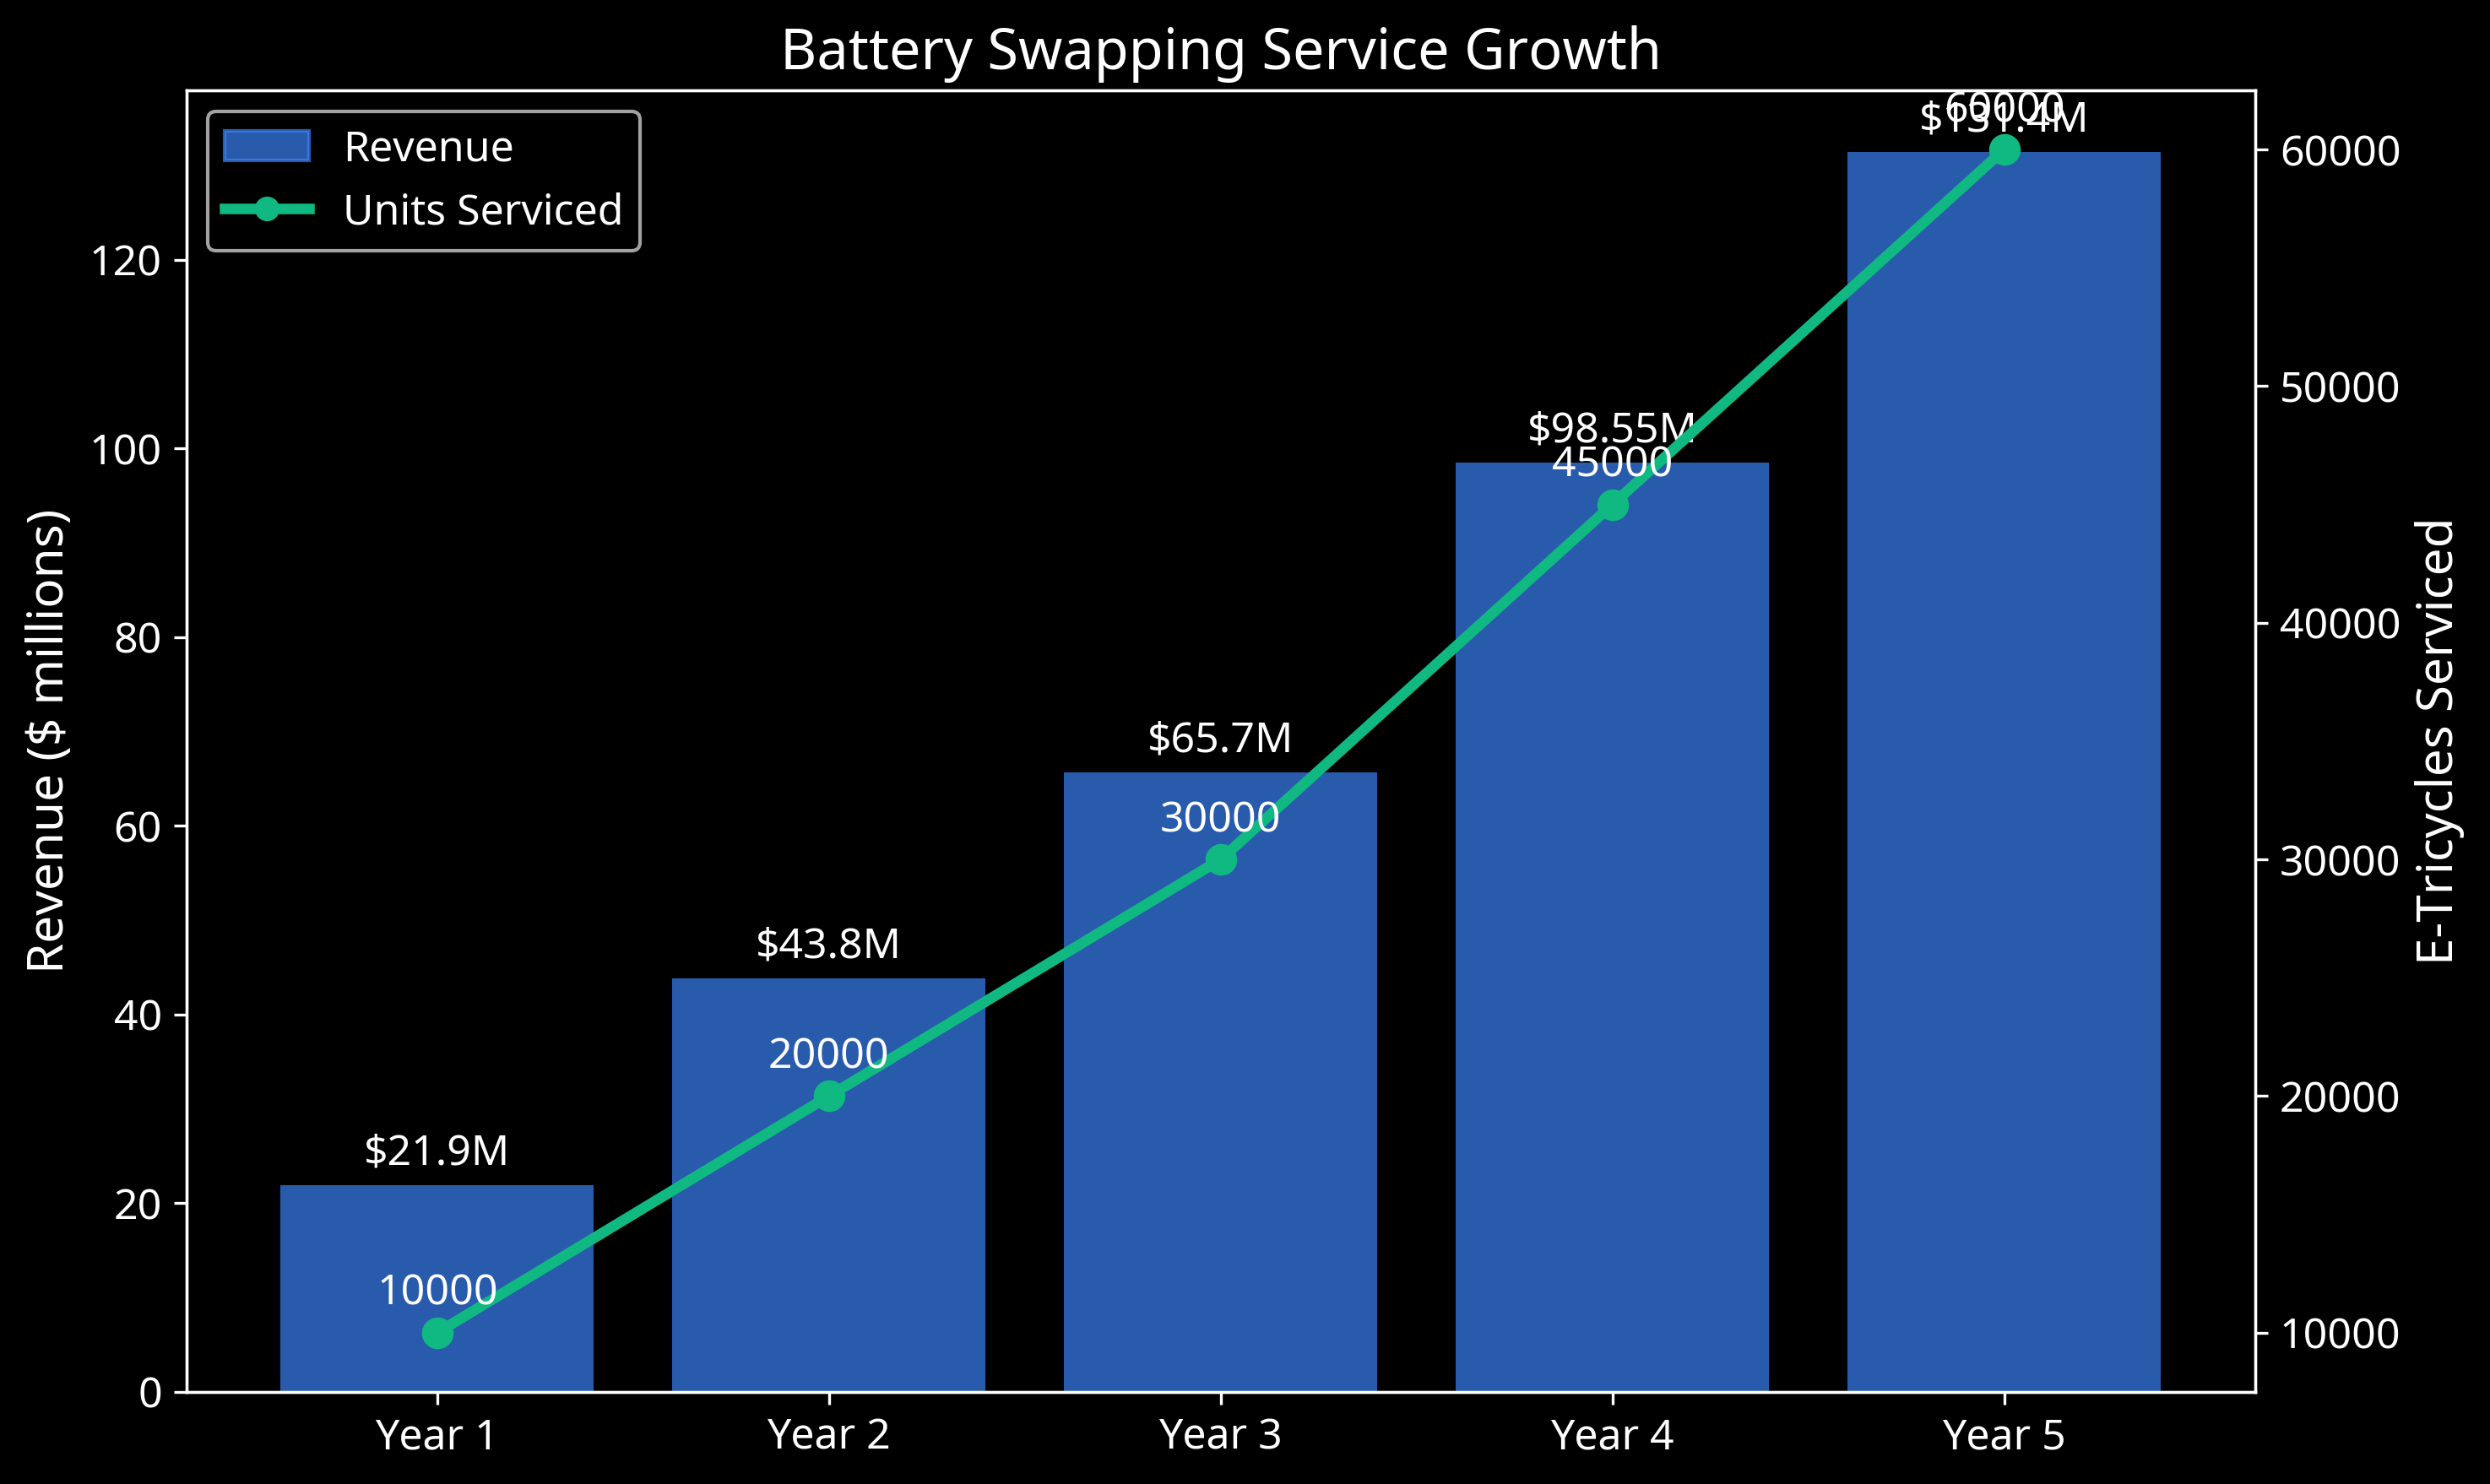
Combined chart showing Battery Swapping revenue growth (bars) and the number of e-tricycles serviced (line), reaching $131.4 million in annual revenue from 60,000 e-tricycles by Year 5.