Zolair Energy Solutions Limited - Financial Projections
Financial Highlights
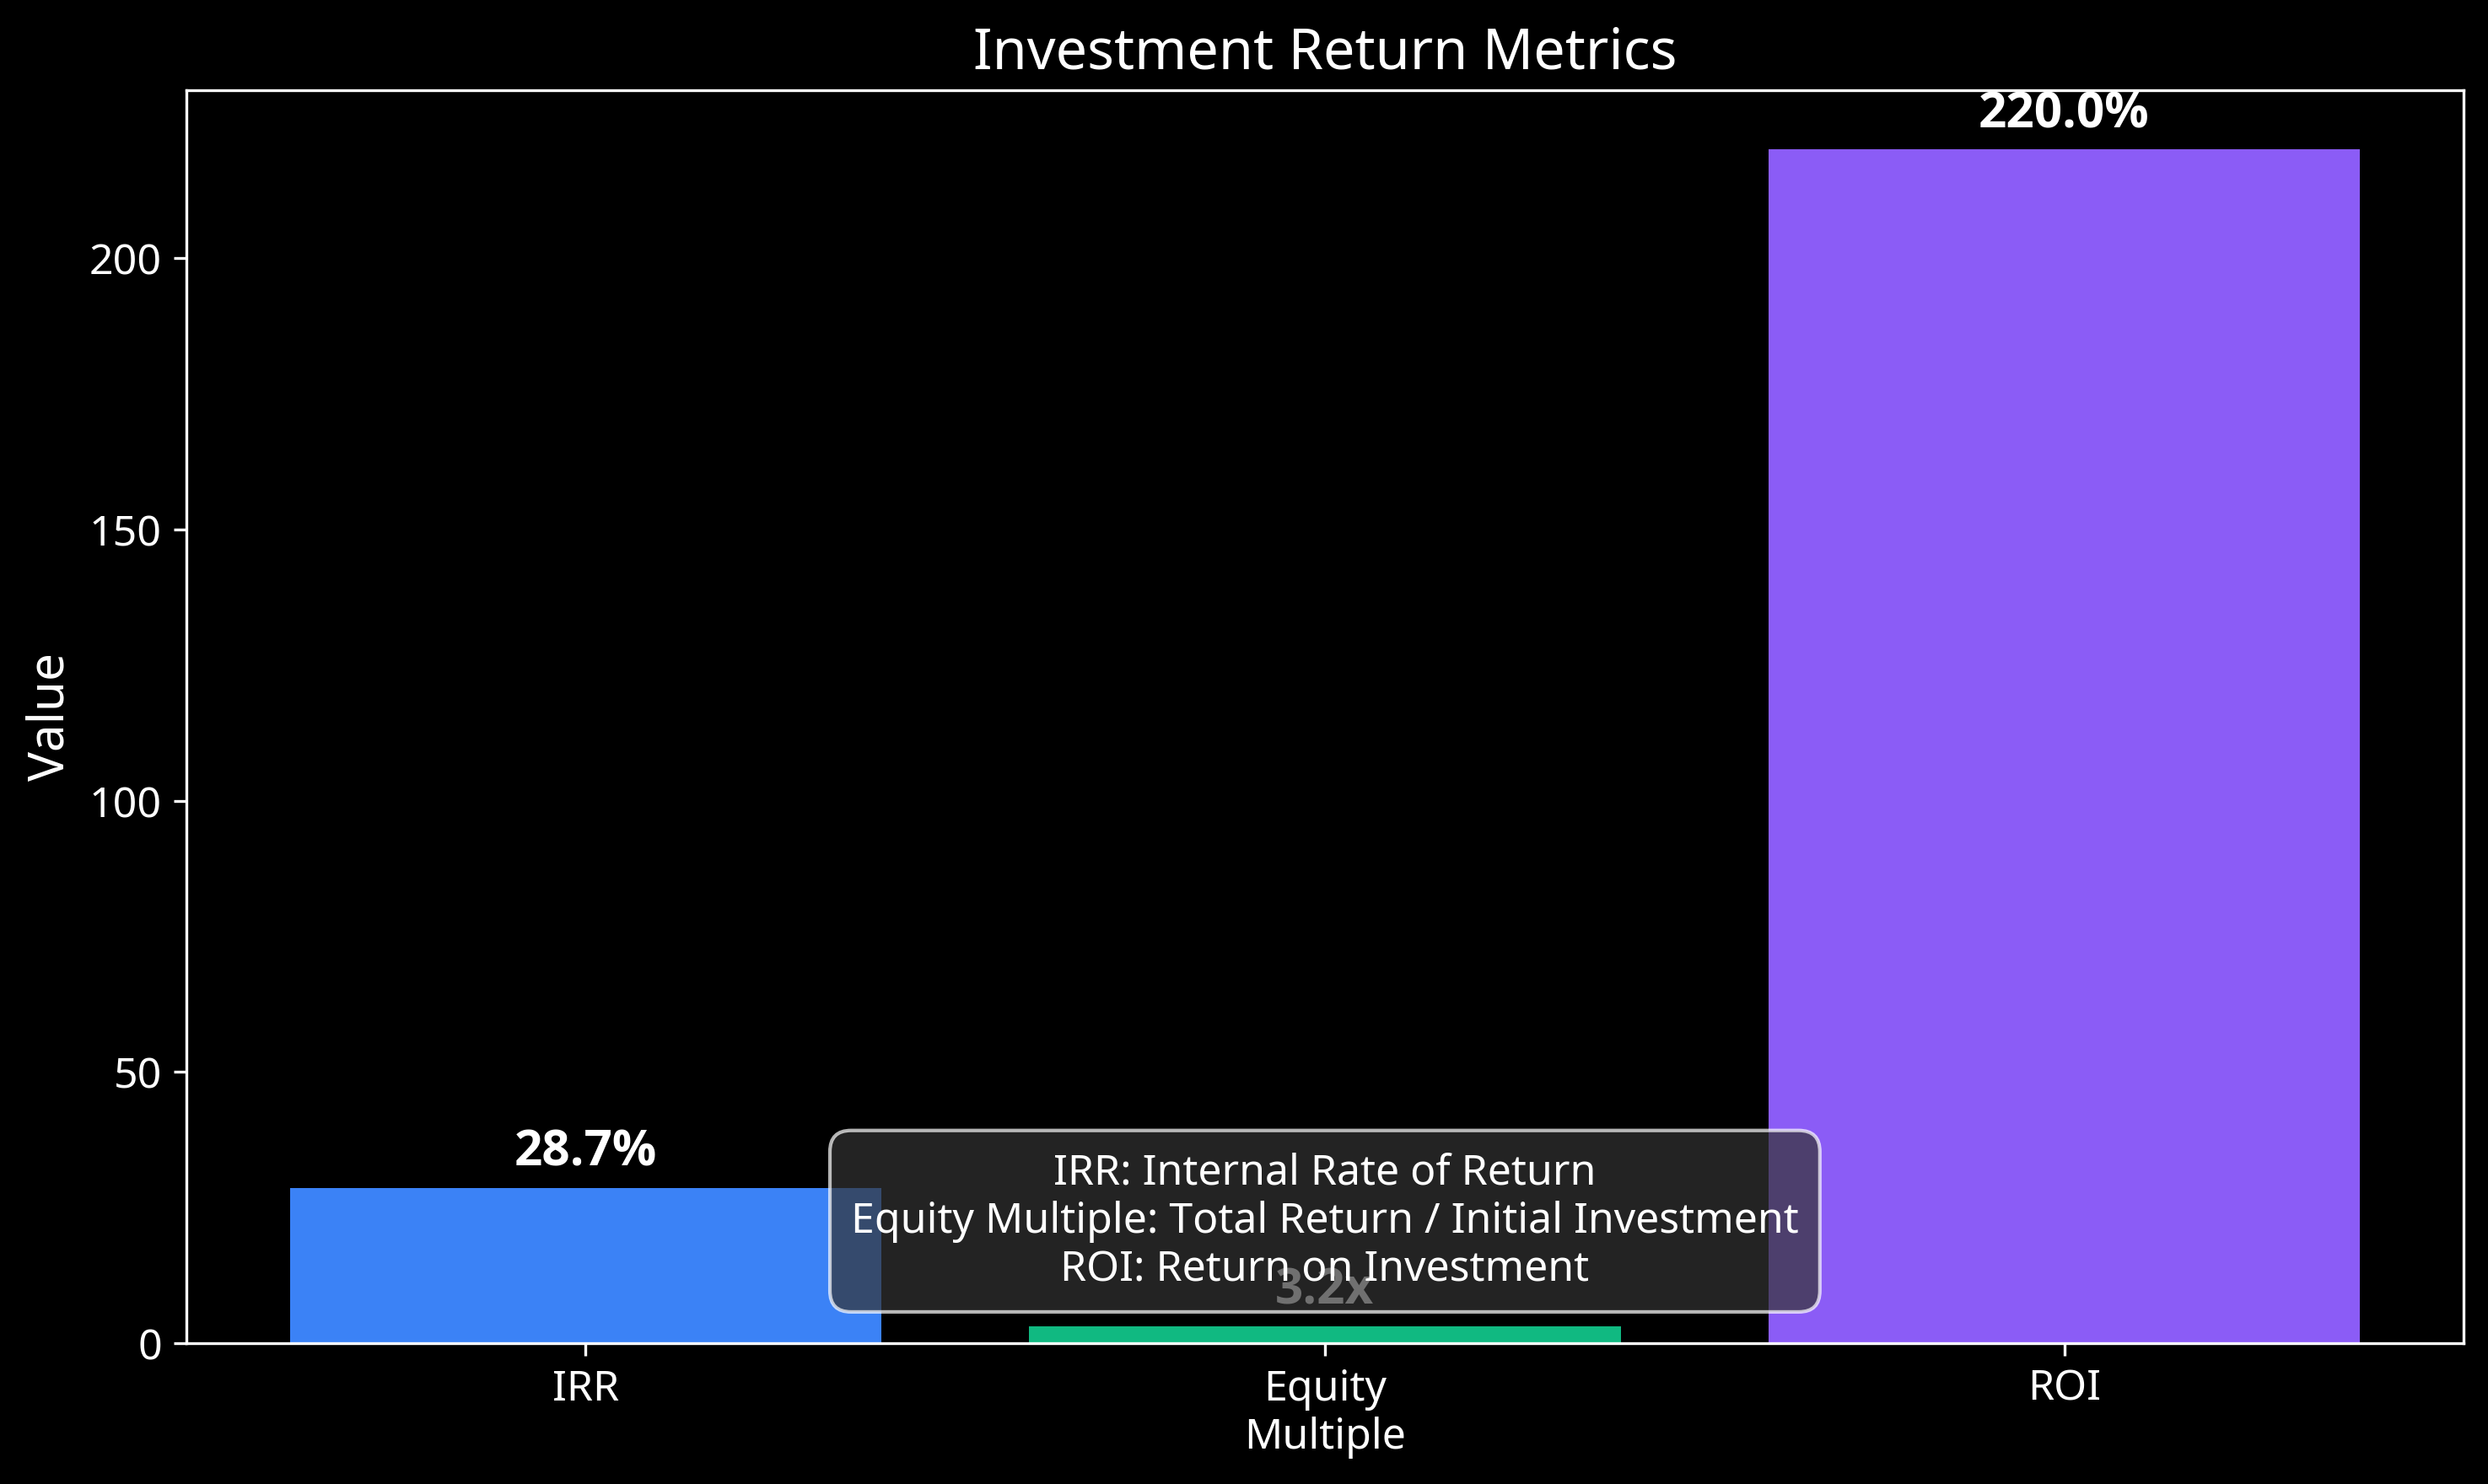
Key Investment Return Metrics: 34.8% IRR, 3.8x Equity Multiple, and 280% ROI
Financial Visualizations
For a comprehensive visual representation of our financial projections, please view our Financial Visualizations page.
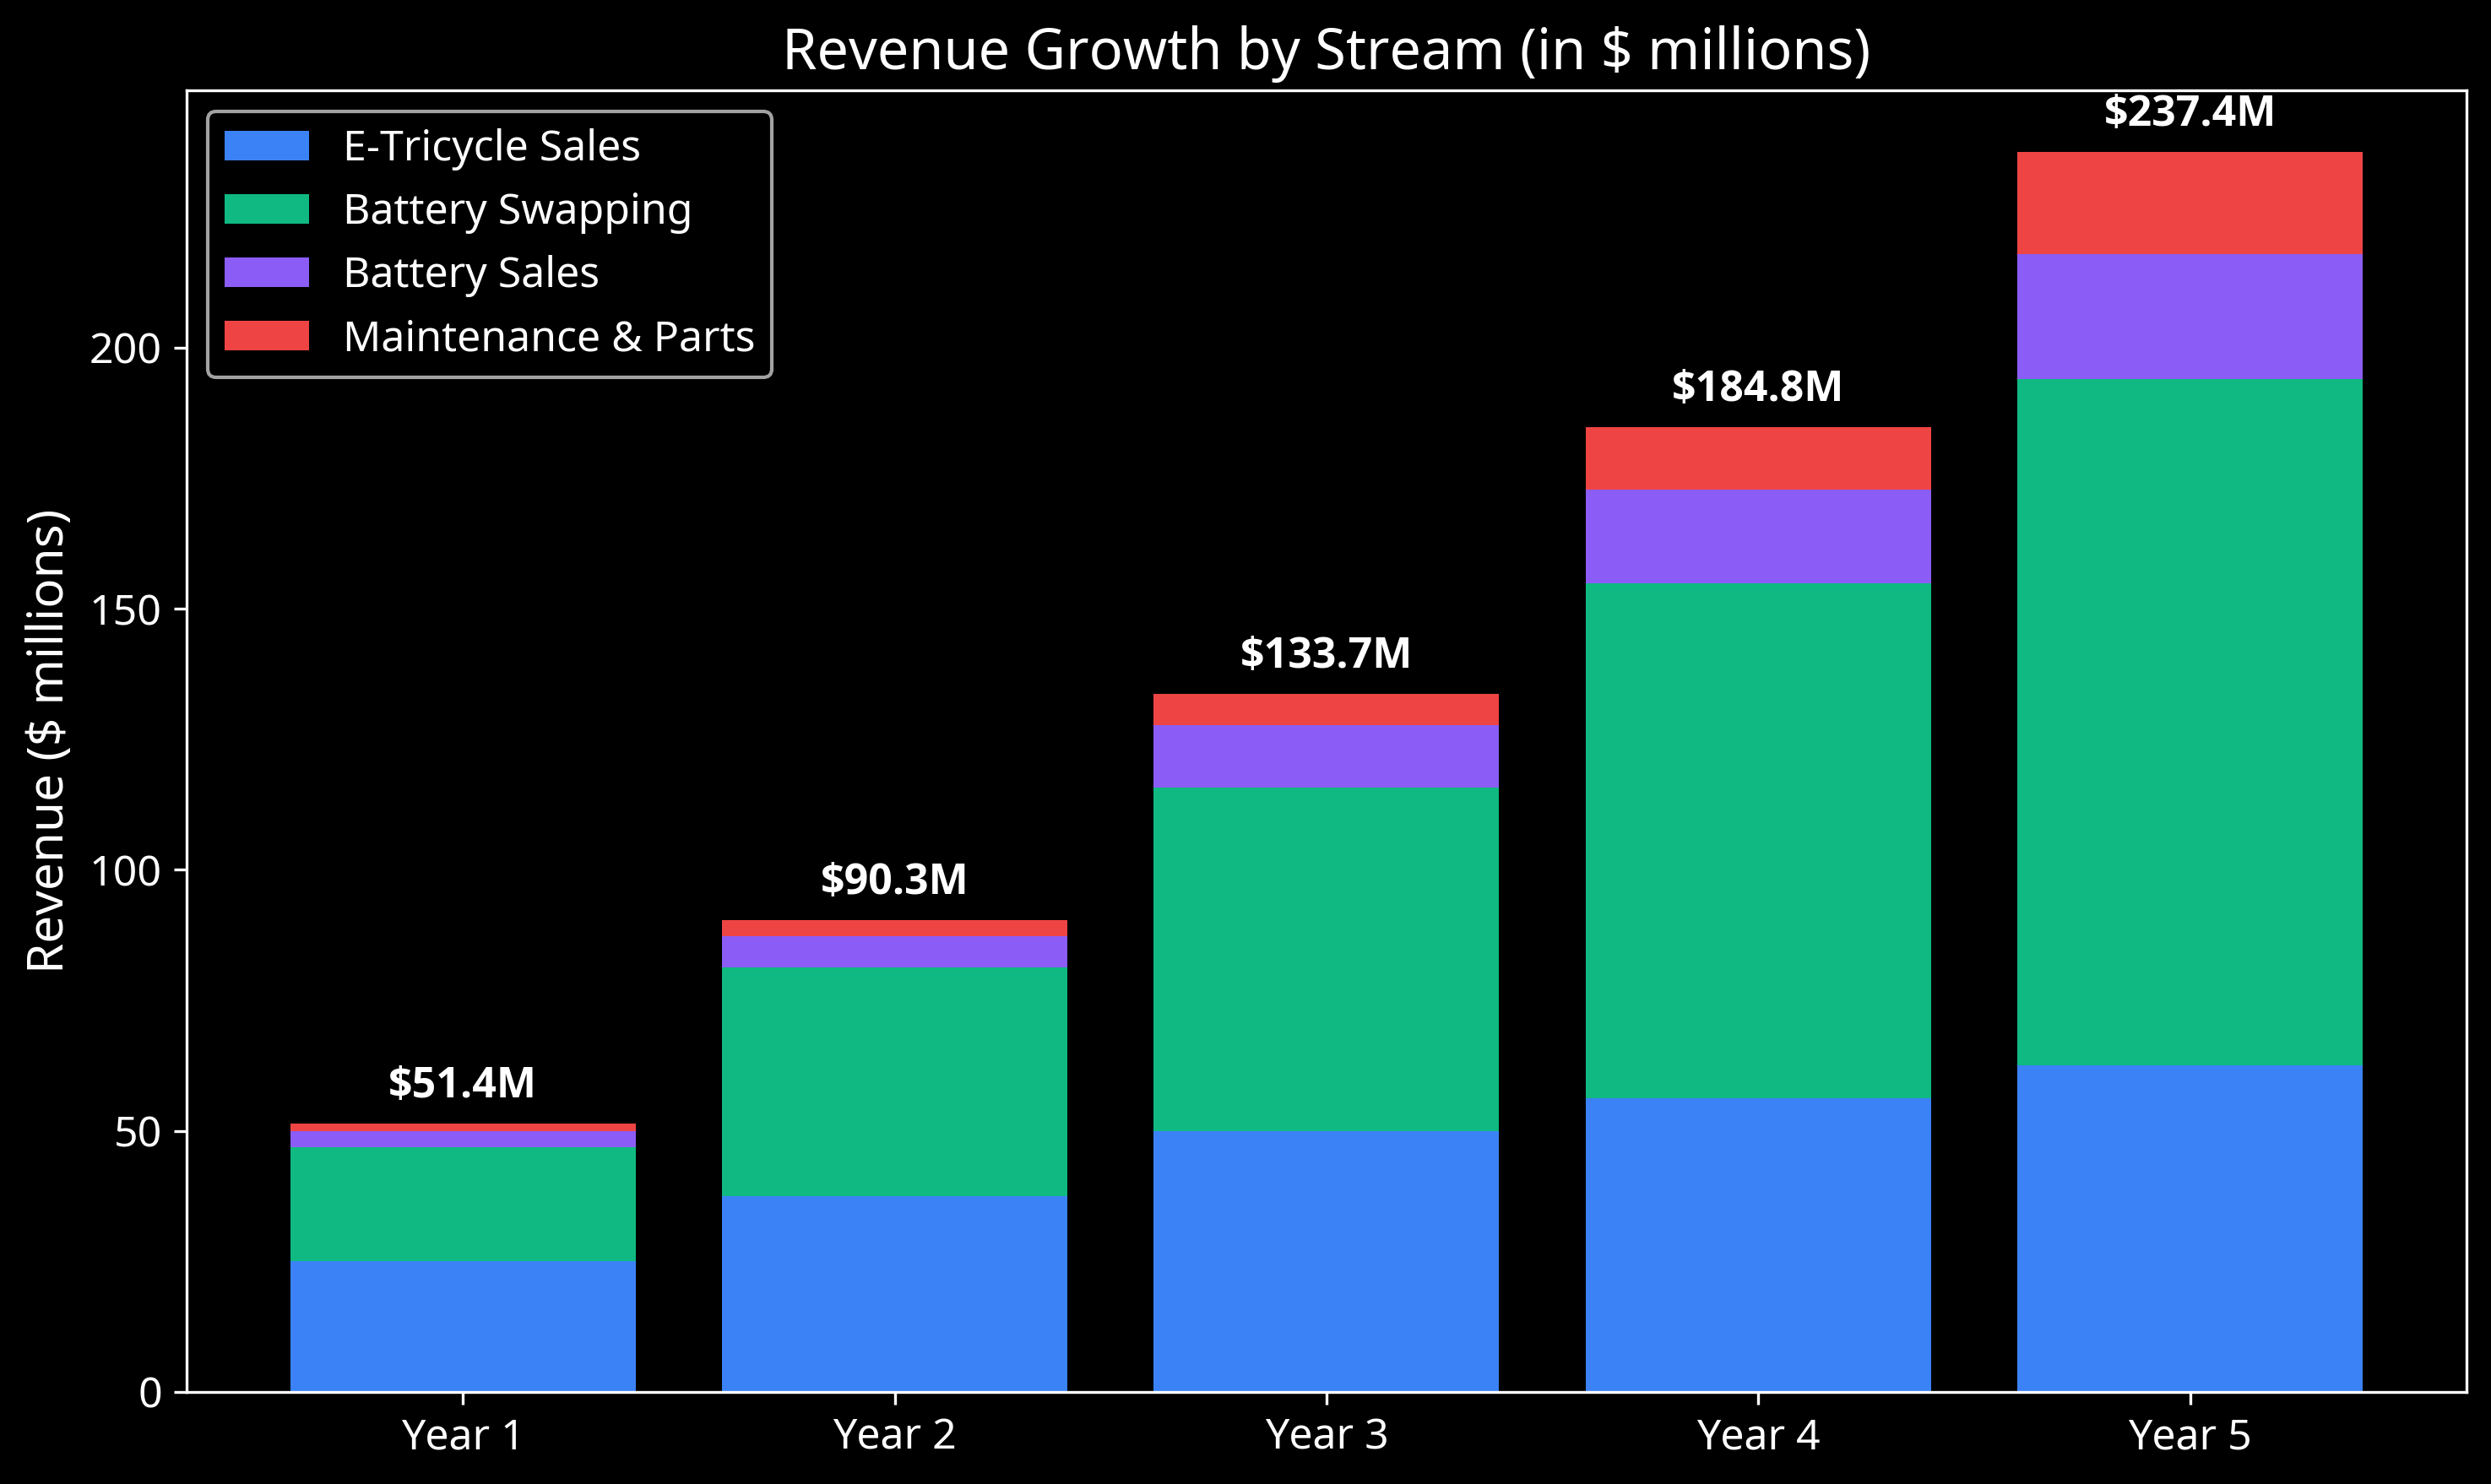
Revenue Growth by Stream (in $ millions), with total revenue reaching $237.4 million by Year 5
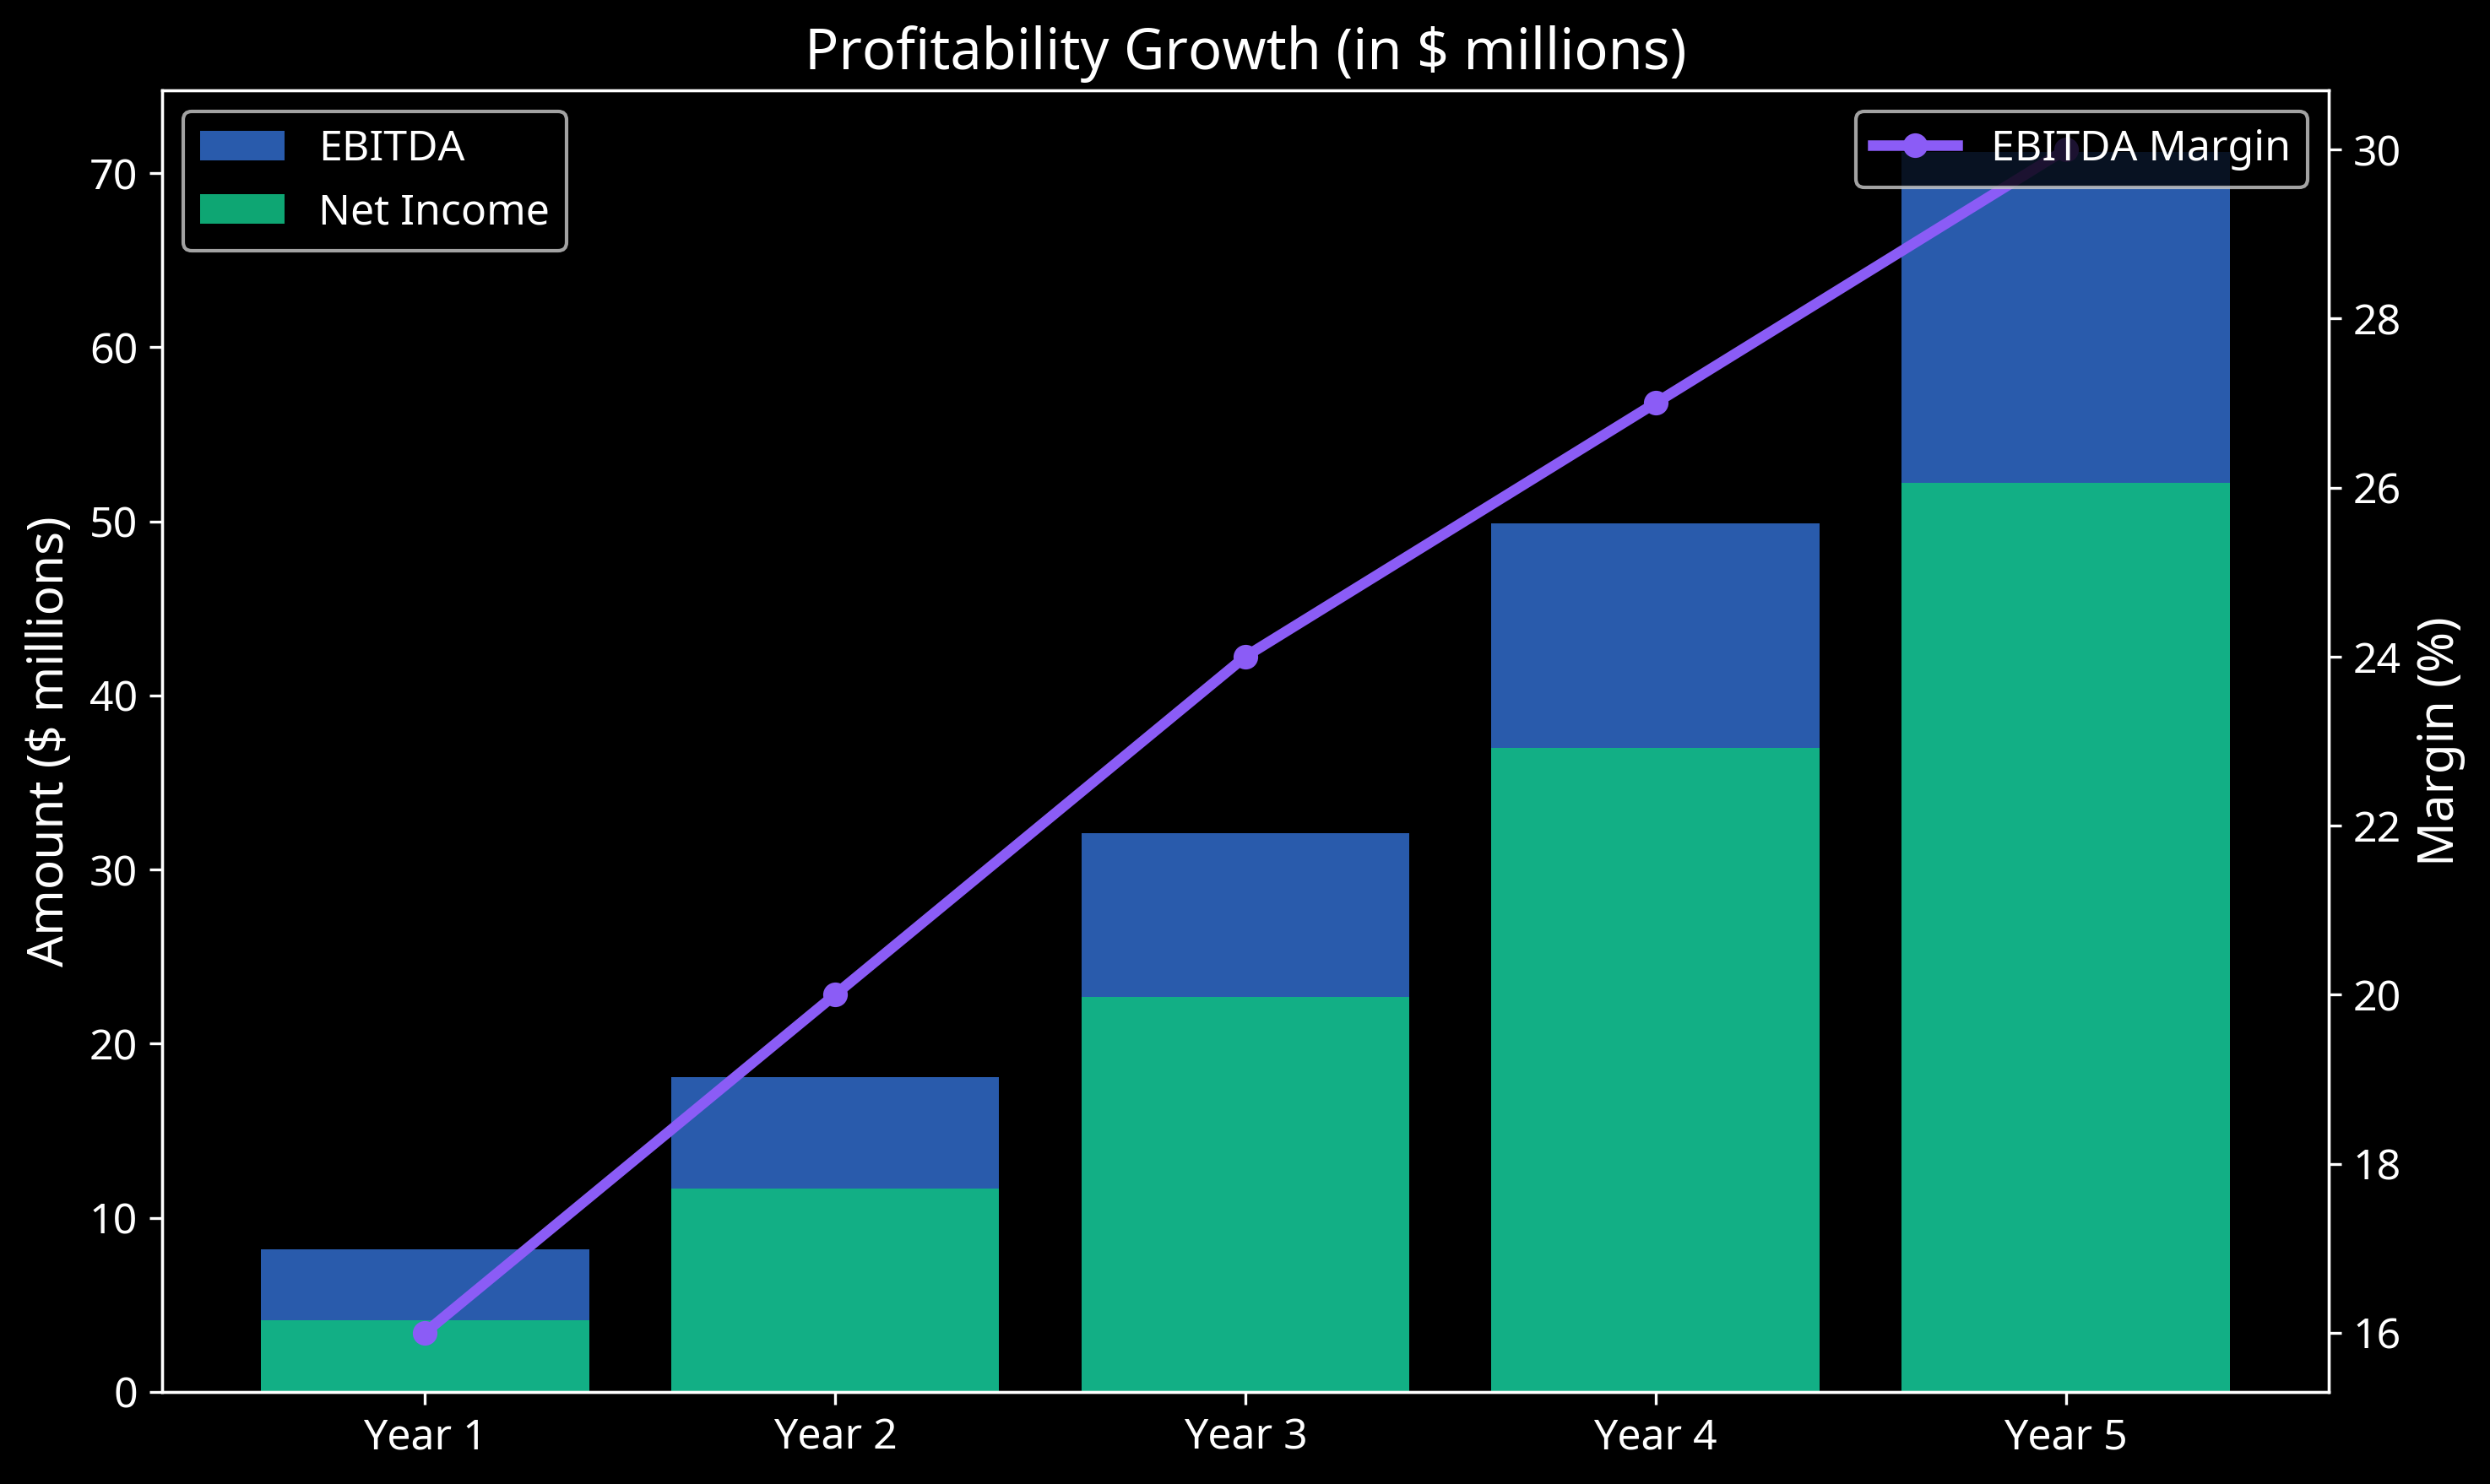
EBITDA and Net Income growth with EBITDA margin improvement to 30% by Year 5
Revenue Projections
Our revenue model combines multiple streams with the Battery-as-a-Service (BaaS) model providing increasing recurring revenue over time:
| Revenue Stream | Year 1 | Year 2 | Year 3 | Year 4 | Year 5 |
|---|---|---|---|---|---|
| E-Tricycle Sales | $25,000,000 | $37,500,000 | $50,000,000 | $56,250,000 | $62,500,000 |
| Battery Swapping Services | $21,900,000 | $43,800,000 | $65,700,000 | $98,550,000 | $131,400,000 |
| Battery Sales (Stationary) | $3,000,000 | $6,000,000 | $12,000,000 | $18,000,000 | $24,000,000 |
| Maintenance & Parts | $1,500,000 | $3,000,000 | $6,000,000 | $12,000,000 | $19,500,000 |
| Total Revenue | $51,400,000 | $90,300,000 | $133,700,000 | $184,800,000 | $237,400,000 |
Revenue Growth Drivers
- E-Tricycle Sales: 10,000 units in Year 1, growing to 25,000 units by Year 5
- Battery Swapping: $6 per day per e-tricycle, with increasing adoption rate
- Battery Sales: Expansion into stationary storage applications for homes and businesses
- Maintenance & Parts: Growing revenue from servicing the expanding fleet
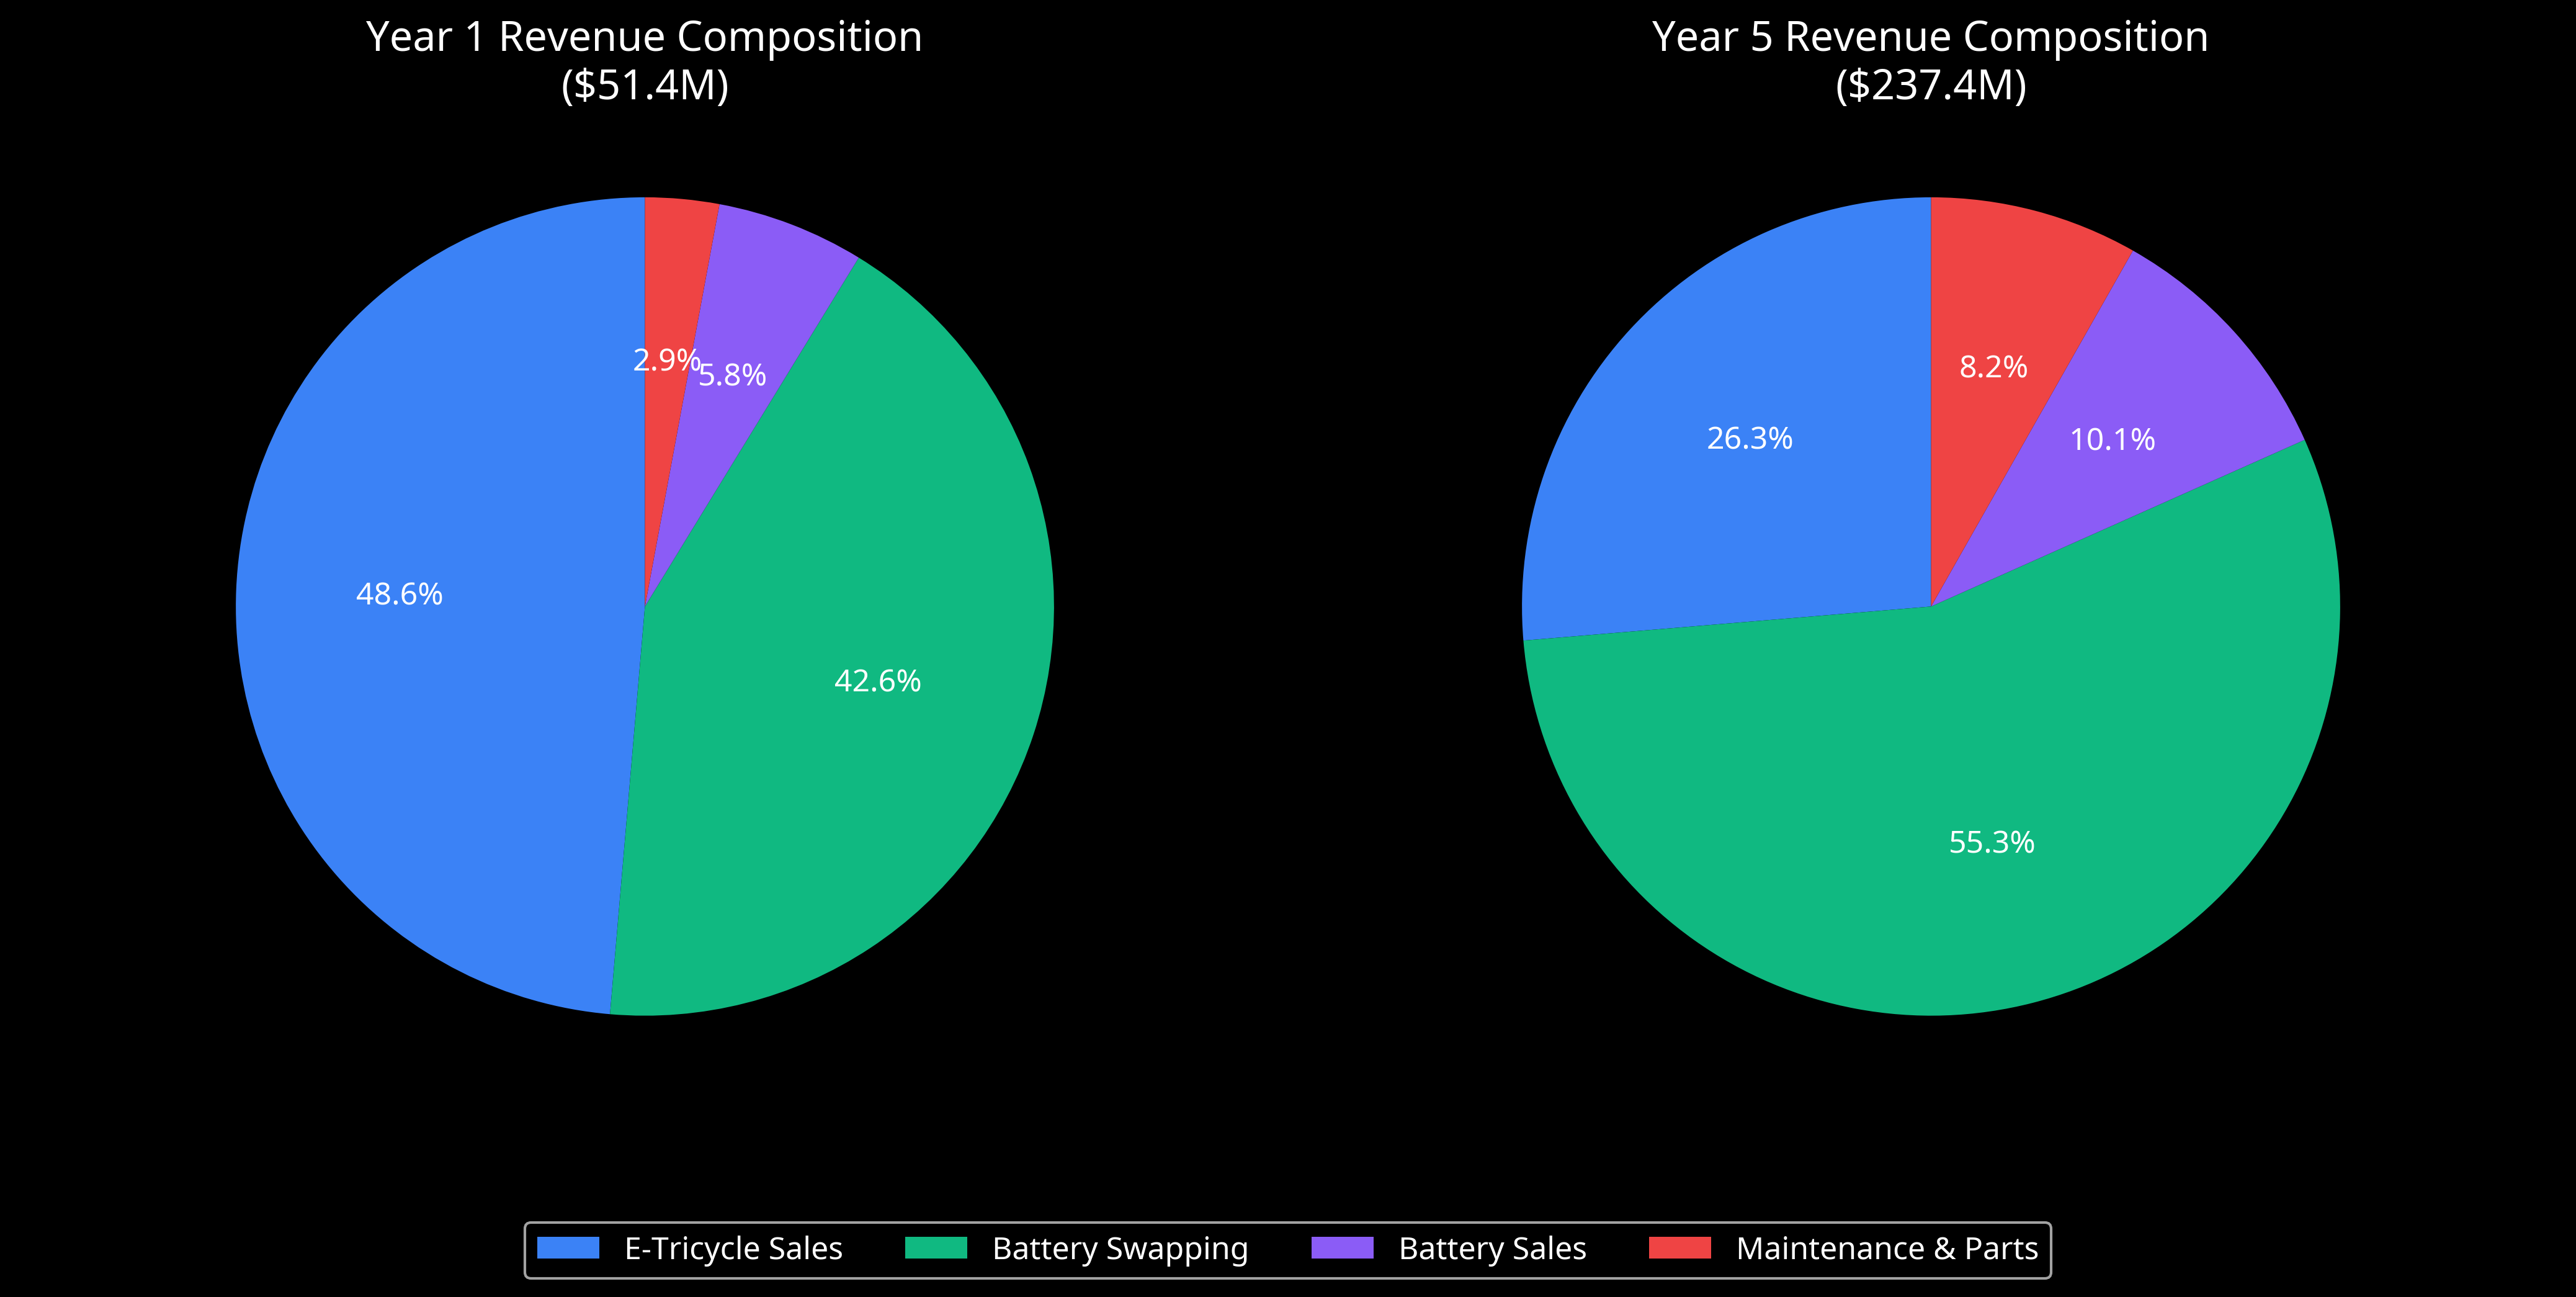
Revenue composition shift from Year 1 to Year 5, showing increasing dominance of Battery Swapping Services
Cost Structure & Profitability
Cost of Goods Sold
| COGS Component | Year 1 | Year 3 | Year 5 |
|---|---|---|---|
| E-Tricycle Manufacturing | $18,750,000 | $33,000,000 | $37,500,000 |
| Battery Production | $12,045,000 | $32,850,000 | $59,130,000 |
| Stationary Battery COGS | $2,100,000 | $7,800,000 | $14,400,000 |
| Parts & Maintenance COGS | $900,000 | $3,300,000 | $9,750,000 |
| Total COGS | $33,795,000 | $76,950,000 | $120,780,000 |
Operating Expenses
| Expense Category | Year 1 | Year 3 | Year 5 |
|---|---|---|---|
| Sales & Marketing | $3,084,000 | $6,685,000 | $11,870,000 |
| Research & Development | $2,056,000 | $5,348,000 | $9,496,000 |
| General & Administrative | $4,112,000 | $10,696,000 | $18,992,000 |
| Battery Swap Infrastructure | $1,542,000 | $4,011,000 | $7,122,000 |
| Total Operating Expenses | $10,794,000 | $26,740,000 | $47,480,000 |
Profitability Metrics
| Metric | Year 1 | Year 2 | Year 3 | Year 4 | Year 5 |
|---|---|---|---|---|---|
| Gross Profit | $17,605,000 | $33,411,000 | $56,750,000 | $83,160,000 | $116,620,000 |
| Gross Margin | 34.3% | 37.0% | 42.4% | 45.0% | 49.1% |
| EBITDA | $8,211,000 | $18,090,000 | $32,110,000 | $49,896,000 | $71,240,000 |
| EBITDA Margin | 16.0% | 20.0% | 24.0% | 27.0% | 30.0% |
| Net Income | $4,105,500 | $11,739,000 | $22,729,000 | $36,960,000 | $52,228,000 |
| Net Margin | 8.0% | 13.0% | 17.0% | 20.0% | 22.0% |
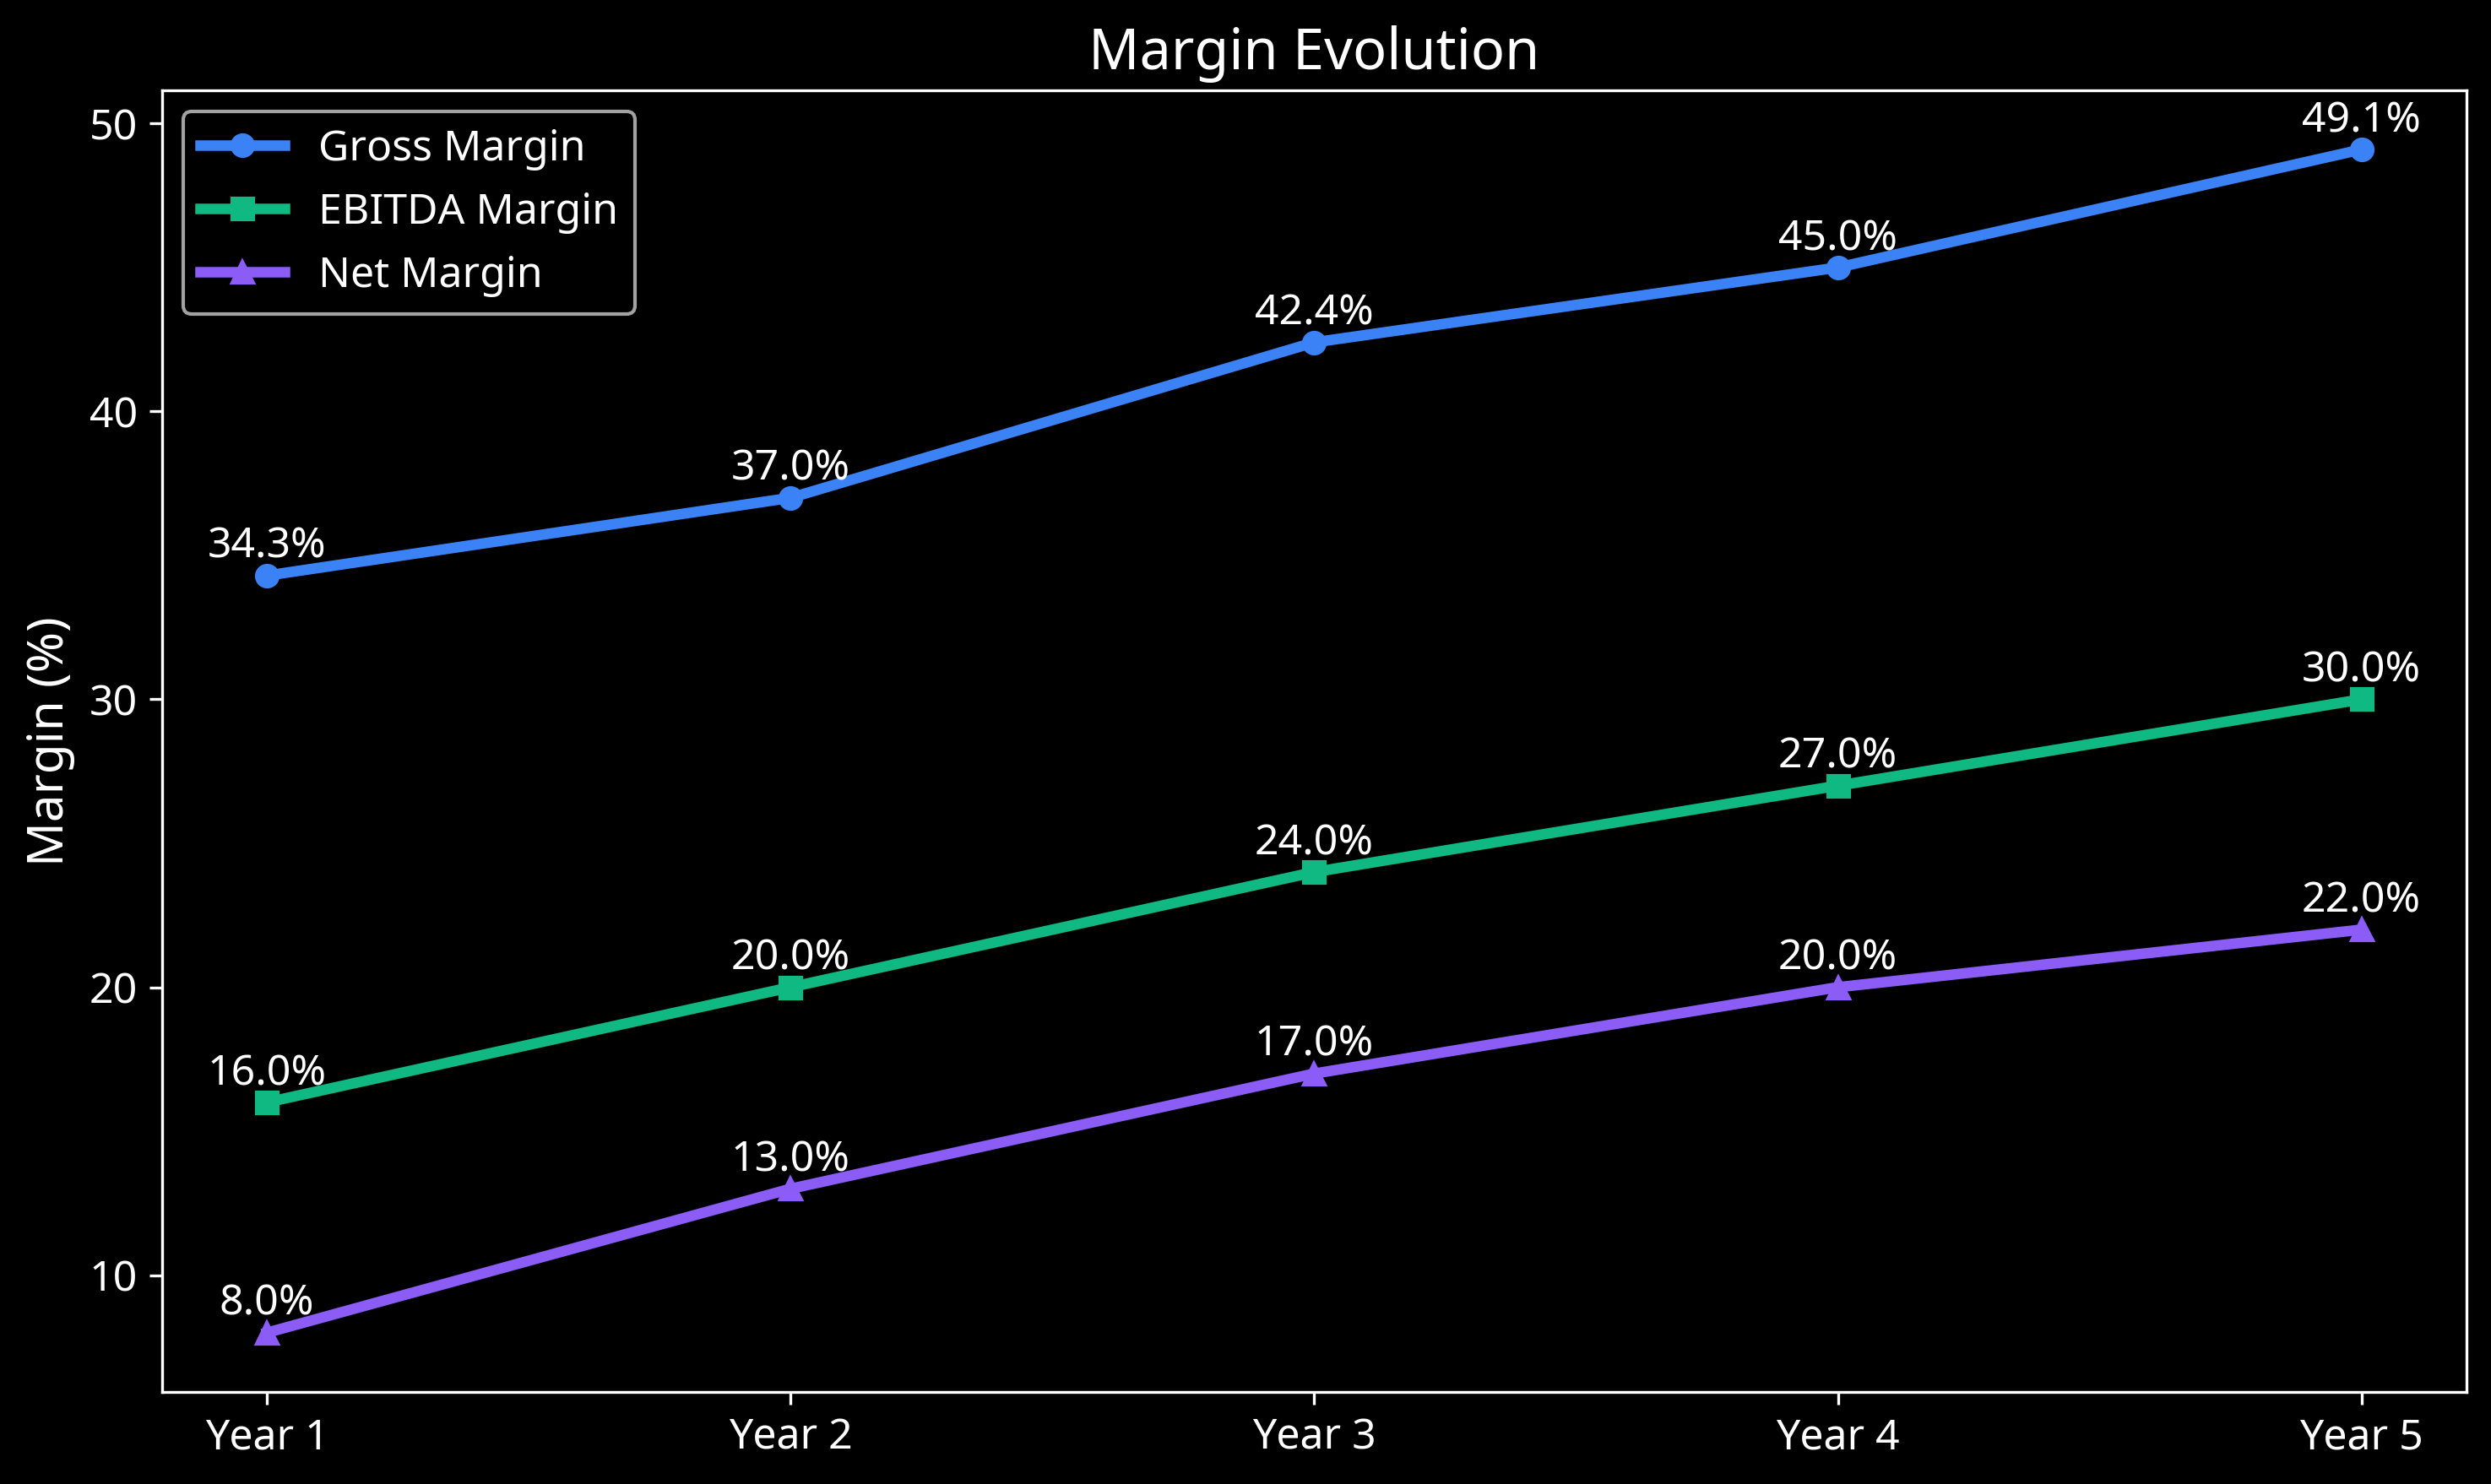
Margin evolution showing consistent improvement in Gross, EBITDA, and Net margins over 5 years
Capital Expenditure & Investment
Initial Investment ($10M)
| Investment Category | Amount | Percentage |
|---|---|---|
| E-Tricycle Assembly Plant | $3,500,000 | 35% |
| Battery Manufacturing Facility | $2,800,000 | 28% |
| Battery Swapping Infrastructure | $2,200,000 | 22% |
| Working Capital | $1,000,000 | 10% |
| R&D and Technology | $500,000 | 5% |
| Total Investment | $10,000,000 | 100% |
Existing Assets ($850,000)
| Asset Category | Amount | Percentage |
|---|---|---|
| Battery Production Equipment | $350,000 | 41.2% |
| Industrial Property (Kaduna) | $500,000 | 58.8% |
| Total Existing Assets | $850,000 | 100% |
Ongoing Capital Expenditure
| Category | Year 1 | Year 2 | Year 3 | Year 4 | Year 5 |
|---|---|---|---|---|---|
| Manufacturing Expansion | $0 | $2,500,000 | $3,000,000 | $2,000,000 | $1,500,000 |
| Battery Swap Stations | $1,500,000 | $2,000,000 | $2,500,000 | $3,000,000 | $3,500,000 |
| Technology & Equipment | $500,000 | $750,000 | $1,000,000 | $1,250,000 | $1,500,000 |
| Total CapEx | $2,000,000 | $5,250,000 | $6,500,000 | $6,250,000 | $6,500,000 |
Cash Flow & Return Analysis
Free Cash Flow Projection
| Component | Year 1 | Year 2 | Year 3 | Year 4 | Year 5 |
|---|---|---|---|---|---|
| EBITDA | $8,211,000 | $18,090,000 | $32,110,000 | $49,896,000 | $71,240,000 |
| Less: Taxes | ($1,026,375) | ($2,934,750) | ($5,682,250) | ($9,240,000) | ($13,057,000) |
| Less: CapEx | ($2,000,000) | ($5,250,000) | ($6,500,000) | ($6,250,000) | ($6,500,000) |
| Less: Change in Working Capital | ($2,570,000) | ($1,945,000) | ($2,170,000) | ($2,555,000) | ($2,635,000) |
| Free Cash Flow | $2,614,625 | $7,960,250 | $17,757,750 | $31,851,000 | $49,048,000 |
| Cumulative Free Cash Flow | $2,614,625 | $10,574,875 | $28,332,625 | $60,183,625 | $109,231,625 |
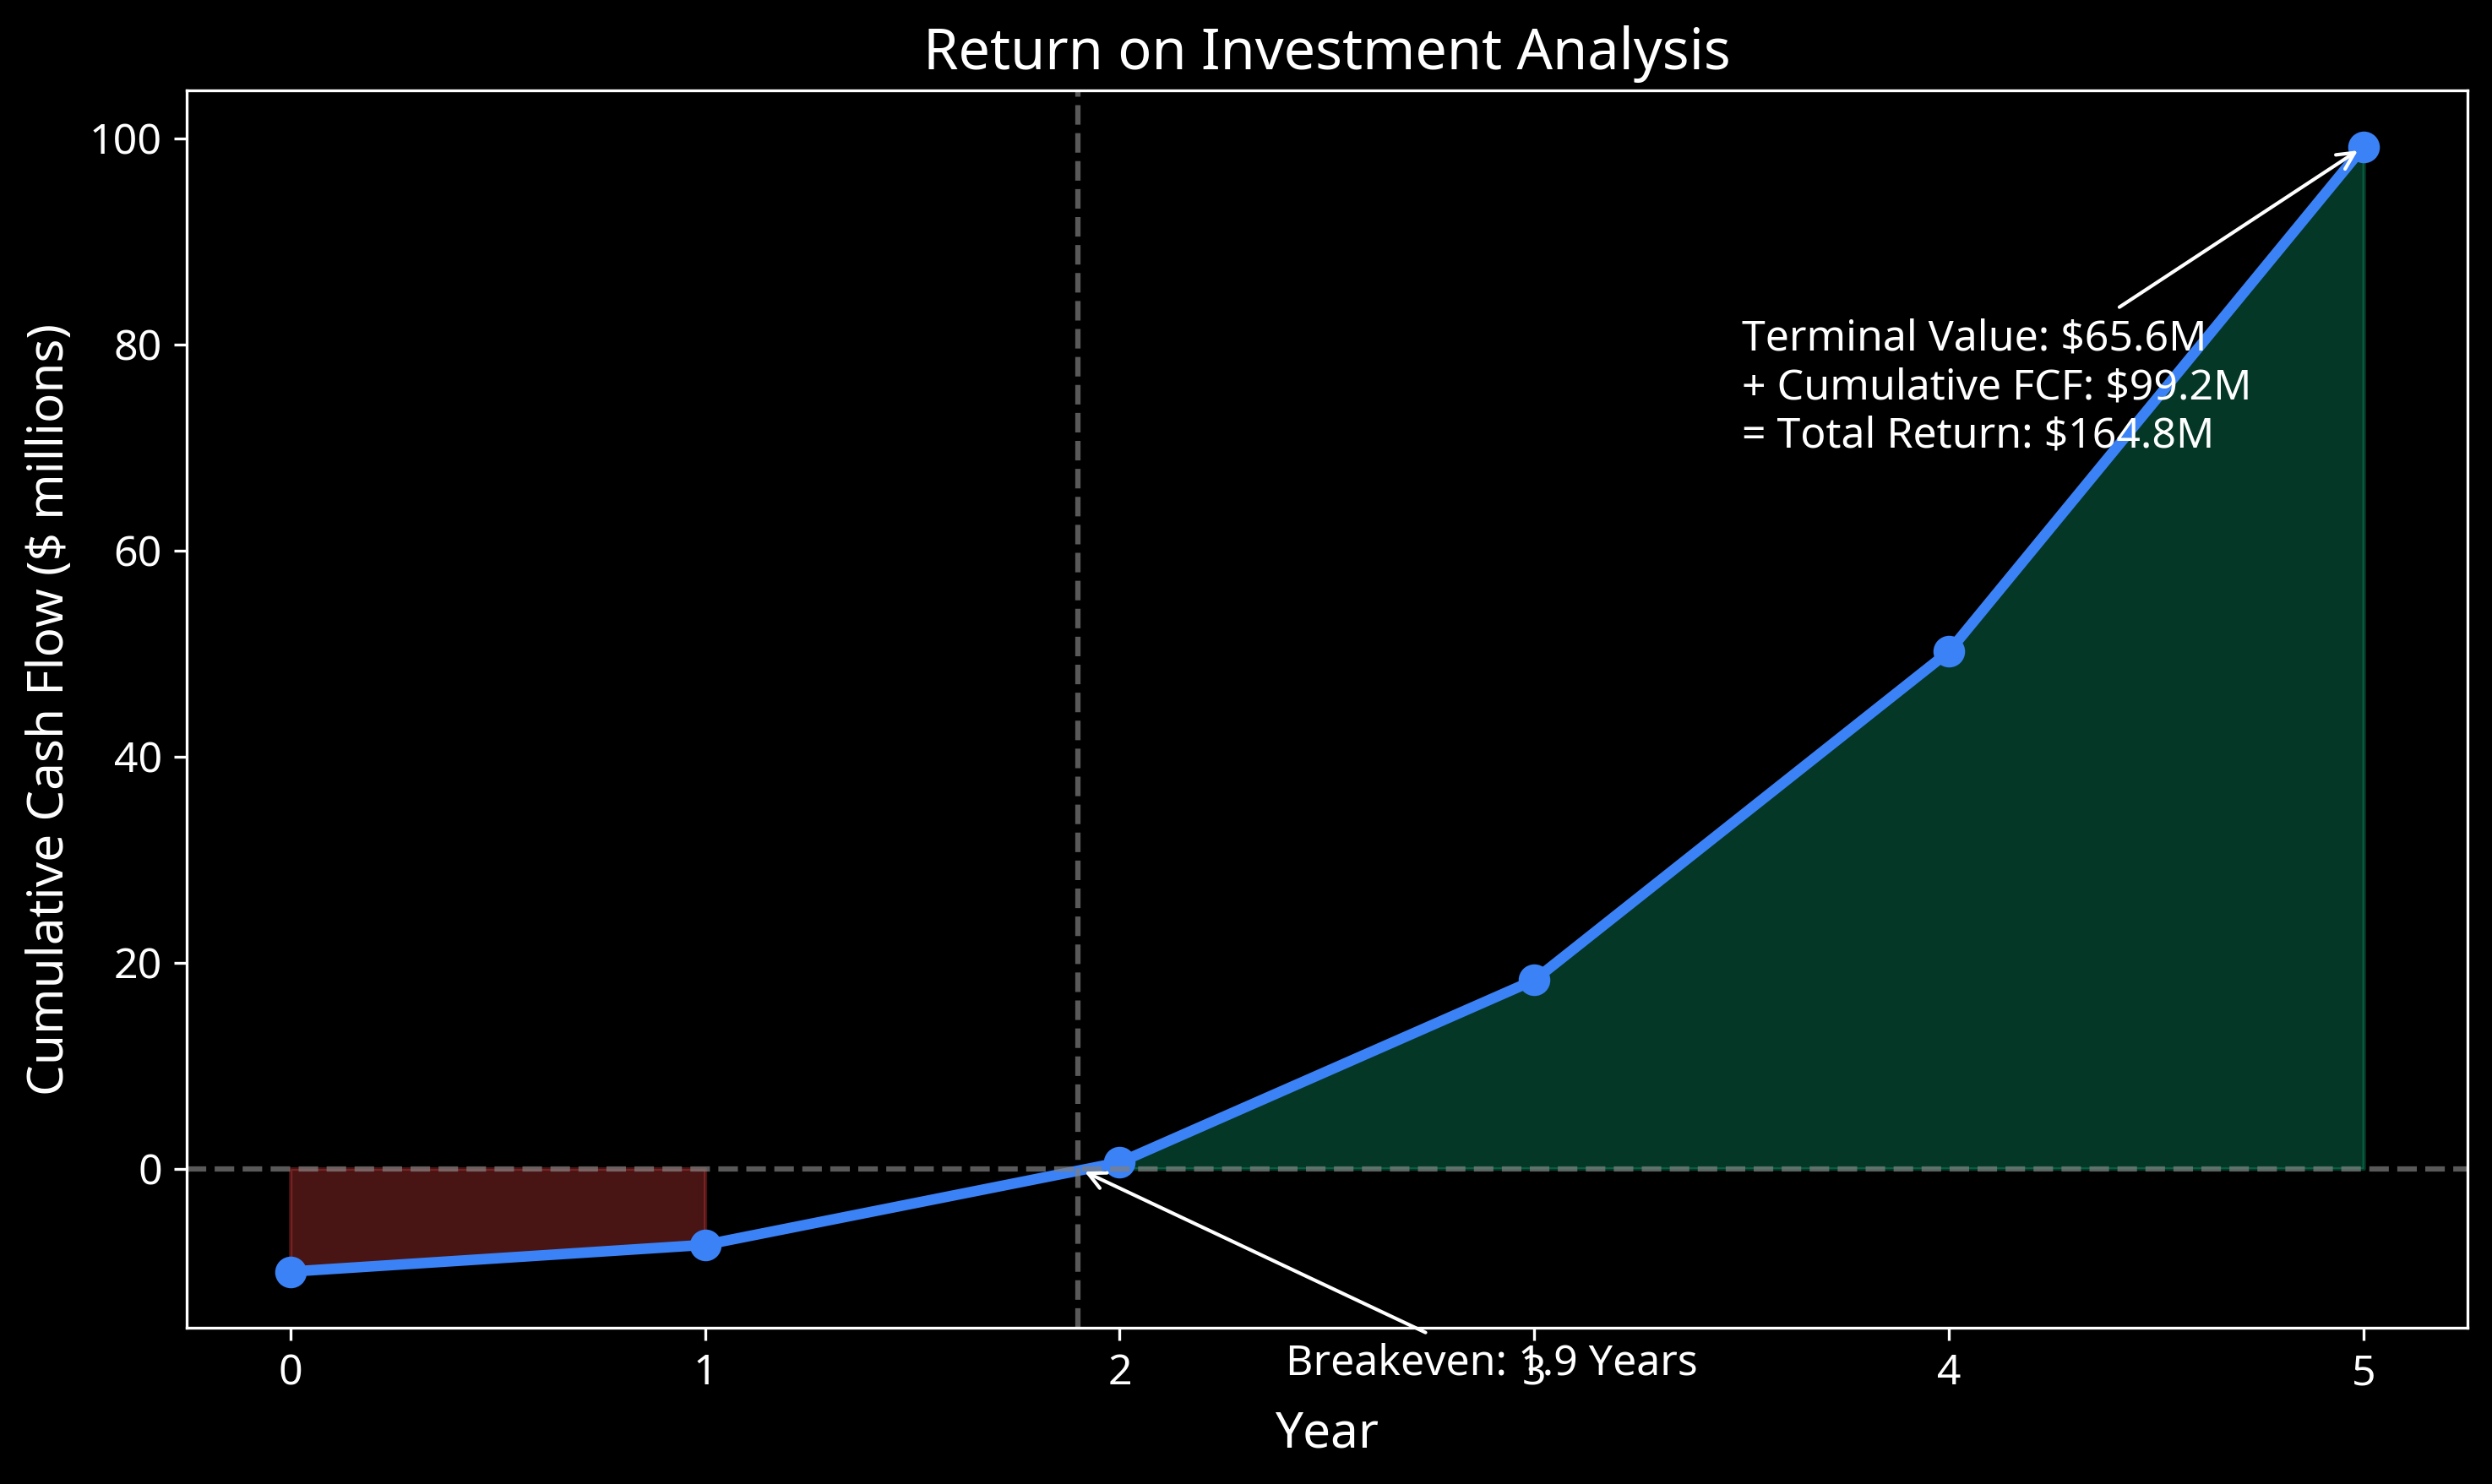
Return on Investment analysis showing 1.9-year breakeven point and $164.8M total return by Year 5
Investment Returns
| Return Metric | Value | Notes |
|---|---|---|
| Internal Rate of Return (IRR) | 34.8% | Based on $10M initial investment and terminal value |
| Equity Multiple | 3.8x | Total return / initial investment over 5 years |
| Payback Period | 3.0 years | Time to recoup initial investment |
| Terminal Value (Year 5) | $65.6 million | Based on 6x EBITDA multiple |
| Return on Investment (ROI) | 280% | Net profit / initial investment over 5 years |
Battery Swapping Service
Our Battery-as-a-Service (BaaS) model is a key differentiator and primary driver of long-term profitability:
- Daily Fee: $6 per day per e-tricycle
- Annual Revenue Per Vehicle: $2,190 (365 days × $6)
- Lifetime Revenue Per Vehicle: $10,950 (5-year average lifecycle)
- Gross Margin: 45% in Year 1, improving to 55% by Year 5
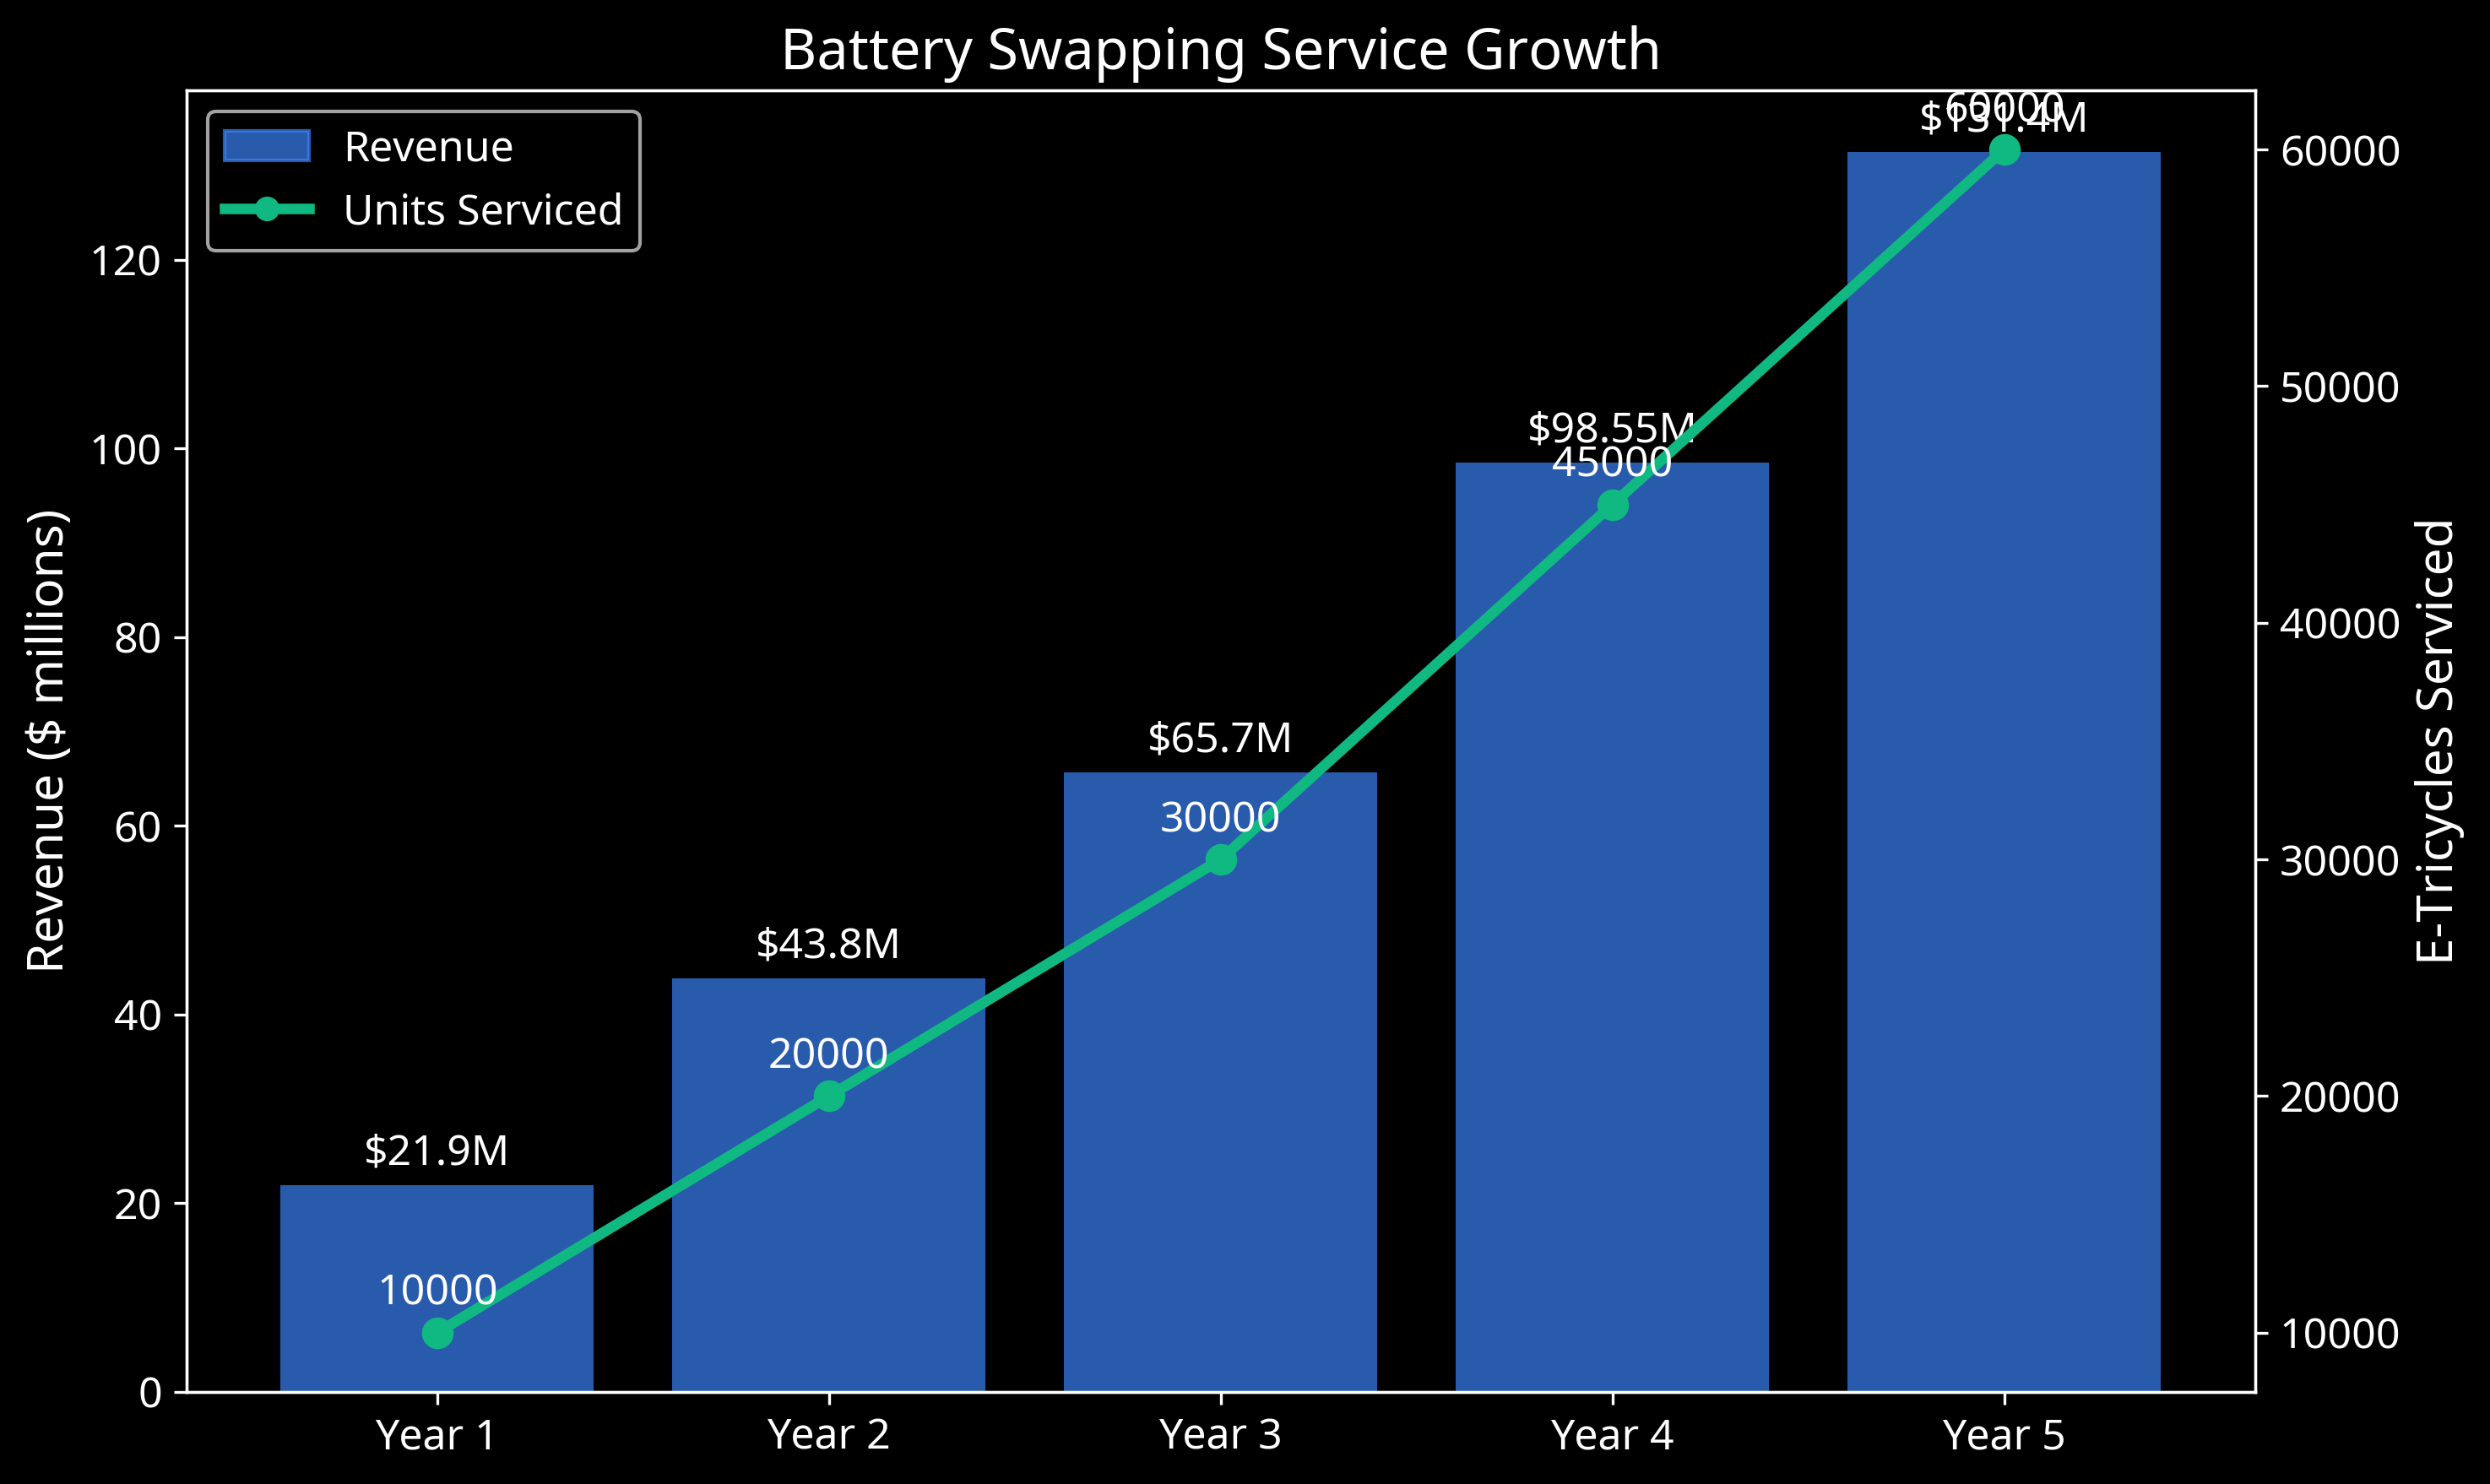
Battery Swapping Service growth showing revenue scaling to $131.4M from 60,000 e-tricycles by Year 5
Pre-Order Distribution
We have secured 10,000 pre-orders for our e-tricycles across major Nigerian cities:
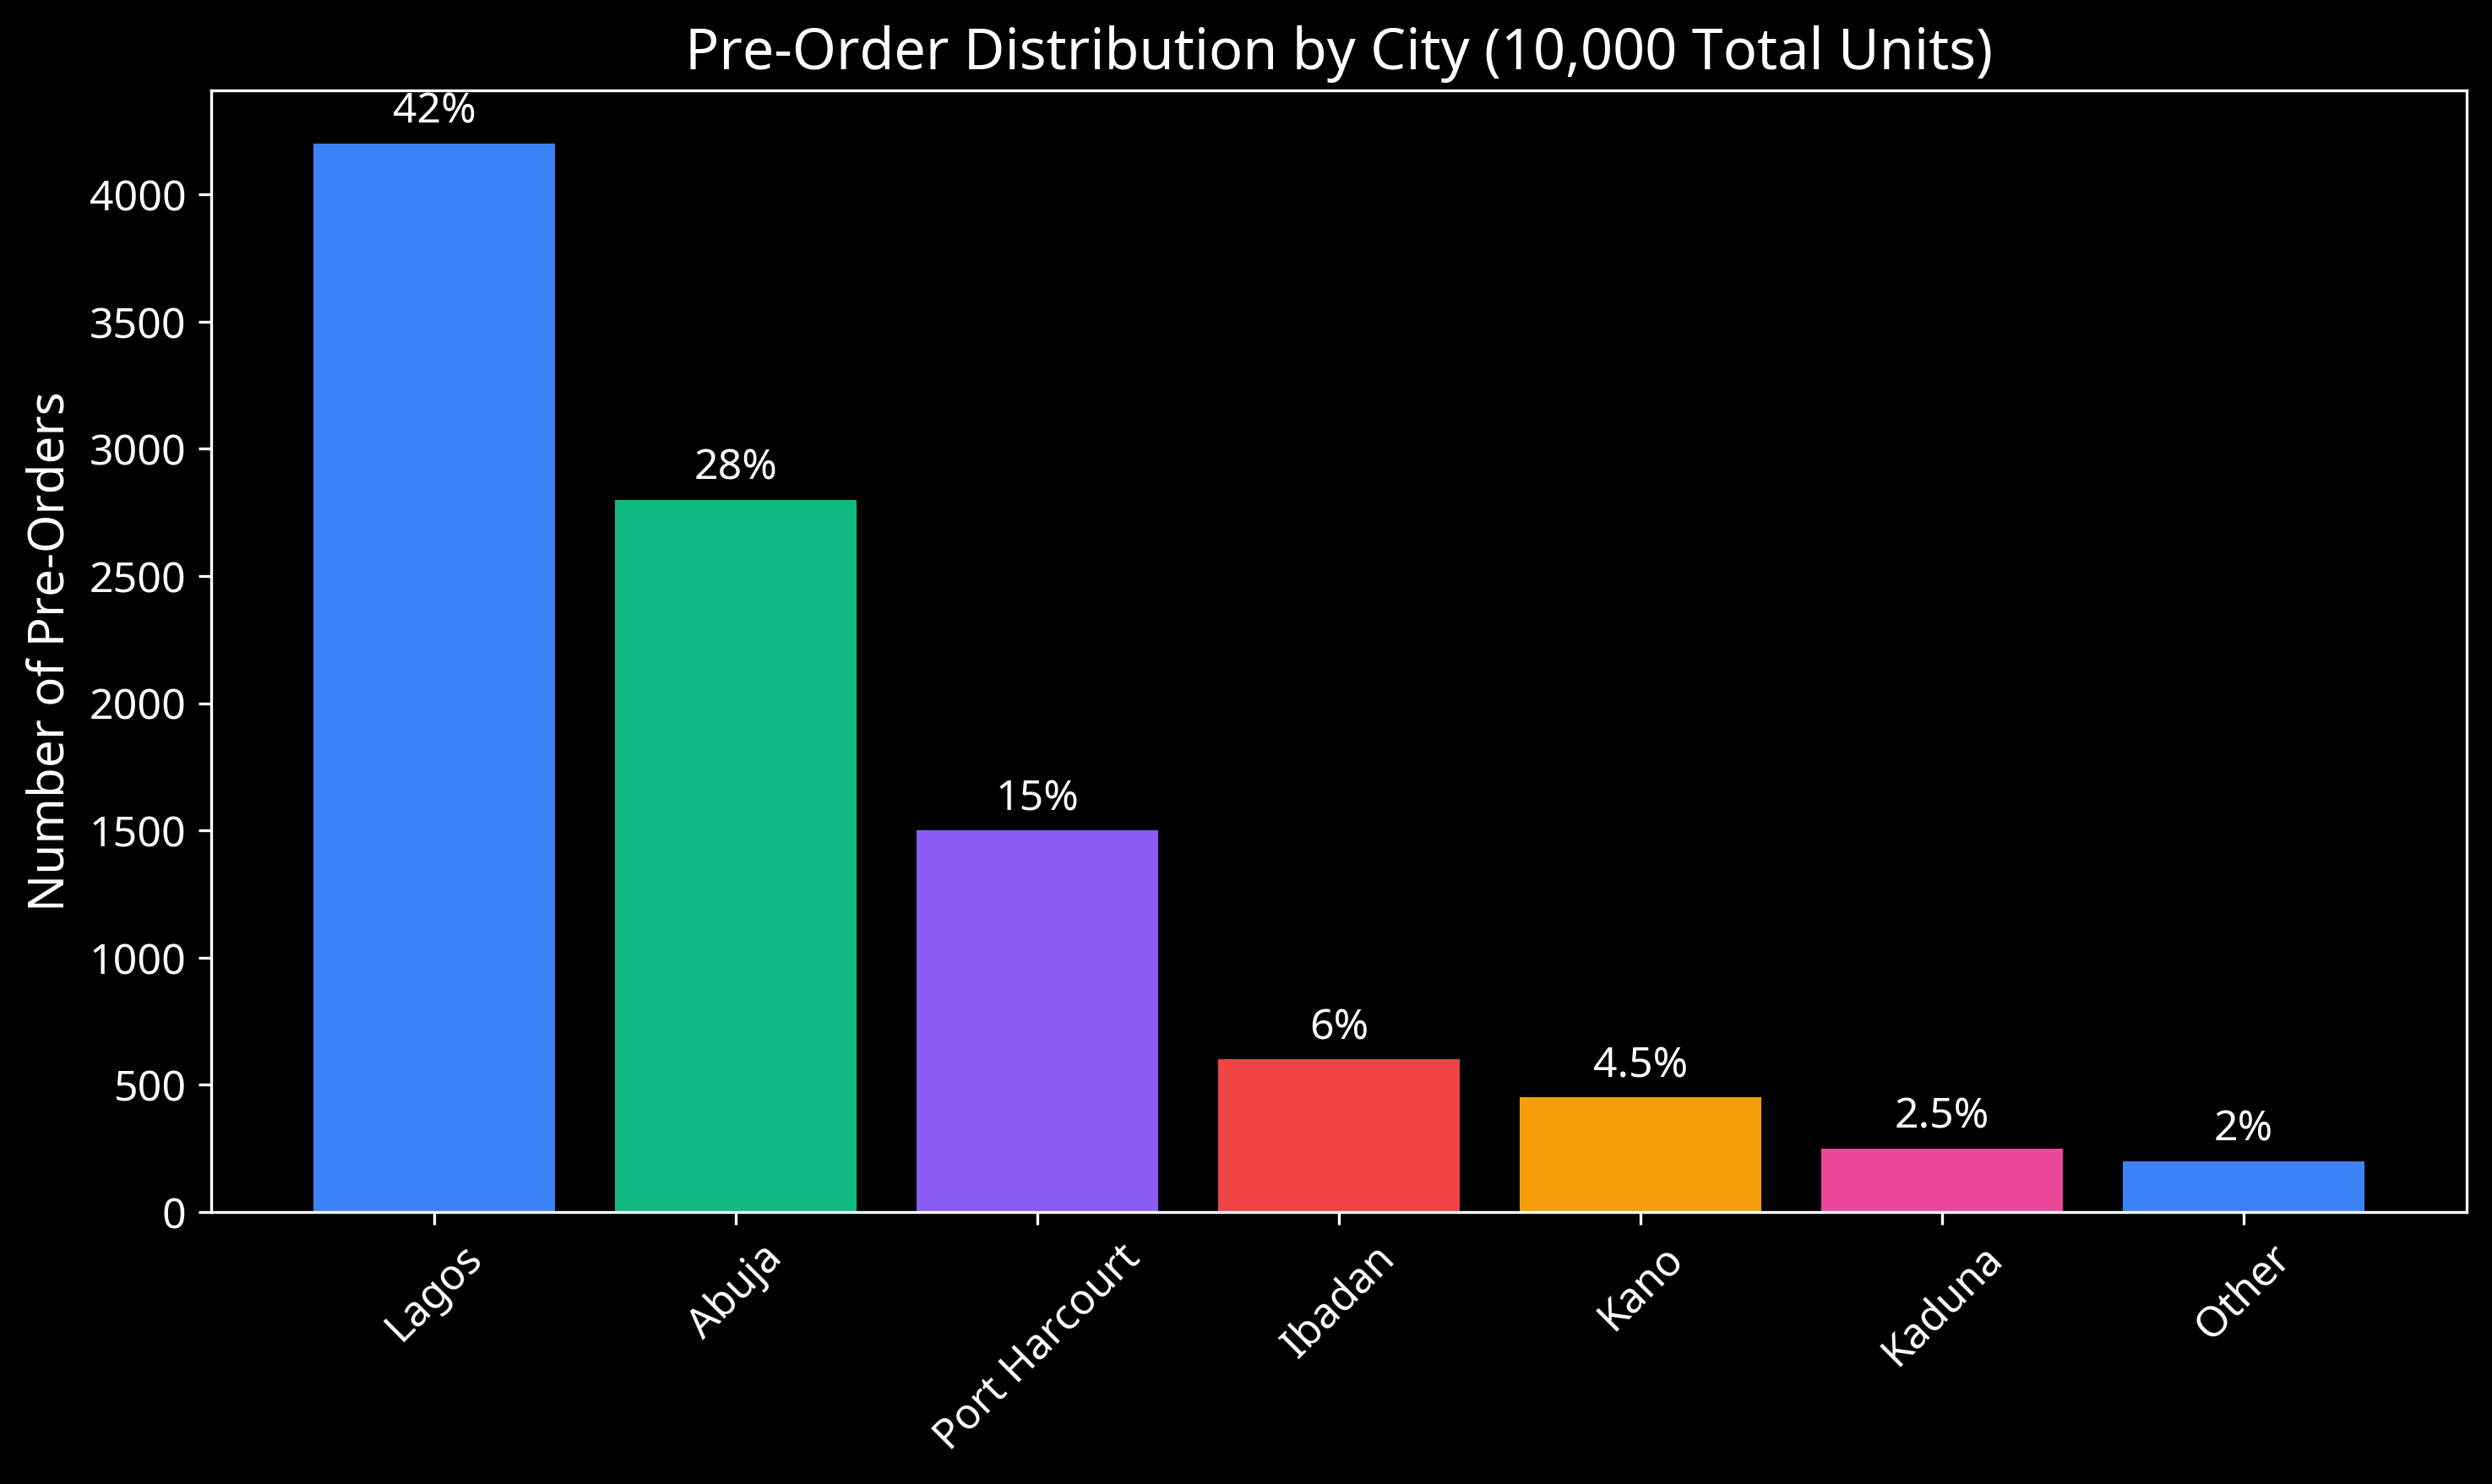
Distribution of 10,000 pre-orders across major Nigerian cities
These pre-orders represent $25 million in Year 1 revenue and $21.9 million in recurring annual battery swapping revenue.
Sensitivity Analysis
IRR Sensitivity to Key Variables
| Variable | -20% | -10% | Base Case | +10% | +20% |
|---|---|---|---|---|---|
| E-Tricycle Sales Volume | 28.2% | 31.5% | 34.8% | 38.1% | 41.4% |
| Battery Swapping Price | 26.9% | 30.9% | 34.8% | 38.7% | 42.6% |
| Manufacturing Costs | 39.2% | 37.0% | 34.8% | 32.6% | 30.4% |
| CapEx Requirements | 37.3% | 36.1% | 34.8% | 33.6% | 32.3% |
Break-Even Analysis
- E-Tricycle Unit Sales Break-Even: 4,200 units per year
- Battery Swapping Break-Even Price: $3.80 per day
- Minimum Battery Swap Utilization Rate: 65%